
JOIN POJC M
Inellecual
Proper and he
U.S. conom:
016 Updae
conomics Saisics
dminisraion
Justin Antonipillai
Counselor to the Secretary
Delegated Duties of the Under Secretary
for Economic Aairs
Robert Rubinovitz, Deputy Chief Economist
David Langdon, Economist and Policy Advisor
Fenwick Yu, Economist
William Hawk, Economist
U.S. Paen and
rademar Oce
Michelle K. Lee
Under Secretary of Commerce for
Intellectual Property and Director,
U.S. Patent and Trademark Oce
Alan C. Marco, Chief Economist
Andrew A. Toole, Deputy Chief Economist
Asrat Tesfayesus, Economist

InellecualProperandheUSconomUpdae i
CNODMNS
e Project Team would like to thank Vikrum Aiyer, Alexander Beck, David Carson, Amy Cotton,
Edward Elliot, Jim Hirabayashi, Amanda Myers, Nicholas Pairolero, Sandy Phetsaenngam, Shi-
ra Perlmutter, Bridget Petruczok, Roy Rabindranath, Patrick Ross, and Daina Spencer from the
USPTO; Nikolas Zolas and Cynthia Davis Hollingsworth from the Census Bureau; omas How-
ells, Gabriel Medeiros, and Amanda Lyndaker from the Bureau of Economic Analysis; and Ryan
Noonan and Rodolfo Telles from the Economics and Statistics Administration’s Oce of the Chief
Economist for their valuable contributions to this report.
ecuie Summar
Innovation and creative endeavors are indispensable elements that drive economic growth and
sustain the competitive edge of the U.S. economy. e last century recorded unprecedented
improvements in the health, economic well-being, and overall quality of life for the entire U.S.
population.
1
As the world leader in innovation, U.S. companies have relied on intellectual prop-
erty (IP) as one of the leading tools with which such advances were promoted and realized. Pat-
ents, trademarks, and copyrights are the principal means for establishing ownership rights to the
creations, inventions, and brands that can be used to generate tangible economic benets to their
owner.
In 2012, the Department of Commerce issued a report titled Intellectual Property and the U.S.
Economy: Industries in Focus (hereaer, the 2012 report). e report identied the industries
that rely most heavily on patents, trademarks, or copyrights as IP-intensive and estimated their
contribution to the U.S. economy. It generated considerable interest and energized other agencies
and organizations to produce similar studies investigating the use and impact of IP across coun-
tries, industries, and rms.
is report builds on the 2012 version by providing an update on the impact of IP on our econo-
my and a fresh look at the approach used to measure those results. e update continues to focus
on measuring the intensity of IP use, and its persistent relationship to economic indicators such
as employment, wages, and value added. While our methodology does not permit us to attribute
those dierences to IP alone, the results provide a useful benchmark. Furthermore, this and other
studies together make clear that IP is a major part of a robust and growing economy.
Accordingly, in an eort to provide a more comprehensive analysis, this report also incorporates
ndings from other studies that target similar research questions but apply dierent methodol-
ogies. Overall, we nd that IP-intensive industries continue to be an important and integral part
of the U.S. economy and account for more jobs and a larger share of U.S. gross domestic product
(GDP) in 2014 compared to what we observed for 2010, the latest gure available for the 2012
report. We discuss these and other results in more detail below.
1 Gordon 2016.

InellecualProperandheUSconomUpdae ii
Principal indings
• IP-intensive industries continue to be a major, integral and growing part of the
U.S. economy.
• is report identies 81 industries (from among 313 total) as IP-intensive. ese IP-inten-
sive industries directly accounted for 27.9 million jobs in 2014, up 0.8 million from 2010.
• Trademark-intensive industries are the largest in number and contribute the most employ-
ment with 23.7 million jobs in 2014 (up from 22.6 million in 2010). Copyright-intensive
industries supplied 5.6 million jobs (compared to 5.1 million in 2010) followed by pat-
ent-intensive industries with 3.9 million jobs (3.8 million in 2010).
• While jobs in IP-intensive industries increased between 2010 and 2014, non-IP-intensive
jobs grew at a slightly faster pace. Consequently, the proportion of total employment in
IP-intensive industries declined slightly to 18.2 percent (from 18.8 percent in 2010).
• In contrast, the value added by IP-intensive industries increased substantially in both total
amount and GDP share between 2010 and 2014. IP-intensive industries accounted for
$6.6 trillion in value added in 2014, up more than $1.5 trillion (30 percent) from $5.06
trillion in 2010. Accordingly, the share of total U.S. GDP attributable to IP-intensive in-
dustries increased from 34.8 percent in 2010 to 38.2 percent in 2014.
• While IP-intensive industries directly accounted for 27.9 million jobs either on their pay-
rolls or under contract in 2014, they also indirectly supported 17.6 million more supply
chain jobs throughout the economy. In total, IP-intensive industries directly and indirectly
supported 45.5 million jobs, about 30 percent of all employment.
• Private wage and salary workers in IP-intensive industries continue to earn signicantly
more than those in non-IP-intensive industries. In 2014, workers in IP-intensive indus-
tries earned an average weekly wage of $1,312, 46 percent higher than the $896 average
weekly wages in non-IP-intensive industries in the private sector. is wage premium has
largely grown over time from 22 percent in 1990 to 42 percent in 2010 and 46 percent in
2014. Patent- and copyright-intensive industries have seen particularly fast wage growth
in recent years, with the wage premium reaching 74 percent and 90 percent, respectively,
in 2014.
• e educational gap between workers in IP-intensive and other industries observed in
2010 virtually disappeared by 2015. e share of workers in IP-intensive industries with a
bachelor’s degree or higher fell from 42.4 percent in 2010 to 39.8 percent in 2015, whereas
that percentage increased from 34.2 percent to 38.9 percent for workers in non-IP-inten-
sive industries.
• Revenue specic to the licensing of IP rights totaled $115.2 billion in 2012, with 28 indus-
tries deriving revenues from licensing.

InellecualProperandheUSconomUpdae iii
• Total merchandise exports of IP-intensive industries increased to $842 billion in 2014
from $775 billion in 2010. However, because non-IP-intensive industries’ exports in-
creased at a faster pace, the share of total merchandise exports from IP-intensive indus-
tries declined to 52 percent in 2014 from 60 percent in 2010.
• Exports of service-providing IP-intensive industries totaled about $81 billion in 2012 and
accounted for approximately 12.3 percent of total U.S. private services exported in 2012.

InellecualProperandheUSconomUpdae i
able O Conens
ecuie Summar ..................................................................i
I. Inroducion ......................................................................1
II. he 01 epor and elaed Sudies ...............................................
III. Ideniing IP-Inensie indusries ..................................................
Paens .........................................................................................
rademars .....................................................................................8
Coprighs ......................................................................................9
I. IP-Inensie Indusries in he conom ............................................10
mplomen ................................................................................... 10
oal mplomen Suppored b IP-inensie Indusries .............................................1
IP-Inensie Paroll Jobs b Sae ................................................................ 14
erage ages ................................................................................. 19
ducaion. . . . . . . . . . . . . . . . . . . . . . . . . . . . . . . . . . . . . . . . . . . . . . . . . . . . . . . . . . . . . . . . . . . . . . . . . . . . . . . . . . . . . . .1
alue added ...................................................................................
IP eenue .....................................................................................
oreign rade ...................................................................................
. Conclusion ......................................................................0
ppendi. . . . . . . . . . . . . . . . . . . . . . . . . . . . . . . . . . . . . . . . . . . . . . . . . . . . . . . . . . . . . . . . . . . . . . . . . . 1
Paens .........................................................................................1
racional s. hole Paens Couns ..............................................................1
Mehodolog ..................................................................................
rademars ....................................................................................4
rademar Inensi ............................................................................
op 0 rademar egisering Companies .......................................................8
andom Sample o ll rademar egisraions ...................................................9
Coprighs .....................................................................................46
Combined is o IP-inensie indusries ..........................................................4
NCS ......................................................................

InellecualProperandheUSconomUpdae
I. Inroducion
“Whether through the music or movies that inspire us, the literature that moves
us, or the technologies we rely on each day, ingenuity and innovation serve as the
foundation upon which we will continue to grow our economies and bridge our
cultural identities.”
— President Barack Obama, April 26, 2016
Innovation and creative endeavors are indispensable elements that drive economic growth and
sustain the competitive edge of the U.S. economy. e last century recorded unprecedented im-
provements in the health, economic well-being, and overall quality of life for the entire U.S. pop-
ulation as technological innovation in medicine and groundbreaking scientic advances in many
elds were realized.
2
Tremendous advances in worker productivity boosted individuals’ earning
capacity. is allowed consumers to purchase and enjoy the abundant supply of new products
and increasingly diverse creative works of art. As goods and services became more accessible,
they were distinctively marked so buyers could readily select products that meet their individual
preferences.
Intellectual property (IP) has been a vital instrument for achieving such advances throughout our
nation’s history. A growing number of U.S. and international studies demonstrate the important
role of IP in economic activity. is report shows that IP-intensive industries continue to be a
major, integral and growing part of the U.S. economy. We nd that the 81 industries designated
as IP-intensive directly accounted for 27.9 million jobs and indirectly supported an additional
17.6 million jobs in 2014. Together, this represented 29.8 percent of all jobs in the U.S. e total
value added by IP-intensive industries amounted to 38.2 percent of U.S. GDP and IP-intensive
industries paid 47 percent higher weekly wages compared to other industries. Further, at $842
billion the merchandise exports of IP-intensive industries made up 52 percent of total U.S. mer-
chandise exports. Exports of service-providing IP-intensive industries totaled about $81 billion
in 2012, accounting for 12.3 percent of total U.S. private exports in services.
IP incentivizes the creation of new goods and services by conferring exclusive rights to their
creators. While inventions typically are a product of ingenious endeavors that require long, per-
sistent, and meticulous eort, subsequent duplication and use of such innovations are oen less
costly. Patents add to the incentive that inventors have to invest in costly research and develop-
ment (R&D) by providing the opportunity to reap the rewards of their innovations. In the words
of Abraham Lincoln, the patent system “added the fuel of interest to the re of genius in the
discovery and production of new and useful things.”
3
Similarly, copyrights provide the frame-
work that incentivizes authors to create literary, artistic, musical, dramatic, cinematic, and other
works by granting them the exclusive right to engage in the activities that derive economic bene-
2 Gordon 2016.
3 Nicolay and Hay 1905, 113.

InellecualProperandheUSconomUpdae
ts from their work. us, patents and copyrights serve as tools to stimulate individual, rm, and
industry level entrepreneurial ventures that feed into economic activities nationwide.
To further exploit the potential of their competitive advantage, producers need eective ways
to indicate to consumers the reliability of their products’ source. A trademark “makes eective
competition possible in a complex, impersonal marketplace by providing a means through which
the consumer can identify products which please him and reward the producer with continued
patronage.”
4
Patents, trademarks, and copyrights are the principal means for establishing ownership rights
to the creations, inventions, and brands that can be used to generate tangible economic benets
to their owner. In 2012, the Department of Commerce issued a report titled Intellectual Proper-
ty and the U.S. Economy: Industries in Focus. Produced jointly by the Economics and Statistics
Administration (ESA) and the United States Patent and Trademark Oce (USPTO), the report
aimed to identify the industries that rely most heavily on patents, trademarks, or copyrights as
IP-intensive and estimate the contribution of those industries to the U.S. economy. It generated a
substantial amount of interest in the IP community, both domestically and abroad, and motivat-
ed other agencies and organizations to produce similar studies investigating the use and impact
of IP across countries, industries, and rms.
is update of the 2012 report has two purposes. First, we duplicate the methodology of the 2012
report to examine how the economic contribution of U.S. IP-intensive industries has evolved.
Second, we review related studies that have been completed since 2012, and discuss the contribu-
tions of the dierent methods. e latest results bolster the 2012 ndings, conrming — across a
range of methodologies — the importance of IP in the economy. In fact, the relative contribution
of IP-intensive industries generally increased in the last several years. We describe these and oth-
er results in more detail in Section IV below.
is report attempts to understand the ways in which IP is used across dierent industries. Our
methodology aims to measure the intensity of IP use, but does not directly measure the extent to
which IP incentivizes the creation of new goods and services. We nd dierences in employment,
wages, value added, and other outcomes that are correlated with IP use, although our method-
ology does not permit us to attribute those dierences to IP alone. As in any area of research, no
single study will yield the complete picture.
is is why it is important for policy-makers and researchers to consider multiple methodologies
for understanding how IP functions in the economy. We are encouraged that other organizations,
agencies, and governments have been energized to replicate, extend, or supplement the work
done in the 2012 report. Taken together, these contributions signicantly advance our knowledge.
Persistent research with a solid empirical foundation will continue to provide the evidence upon
which good policy can rest. e evidence to date demonstrates that IP is an important part of a
robust and growing economy.
4 Smith v. Chanel, Inc. 402 F.2d 562, 566 (9
th
Cir. 1968).

InellecualProperandheUSconomUpdae
II. he 01 epor and elaed Sudies
It is instructive to evaluate the methodology and results of the 2012 report in the context of the
related research completed since the rst report’s release. e 2012 report identied IP-intensive
industries, and compared those industries to other industries across a number of dierent di-
mensions. e methodology consisted of identifying IP-intensive industries based on the use of
IP. According to that report, intellectual property protection aects commerce throughout the
economy by:
• Providing incentives to invent and create;
• Protecting innovators from unauthorized copying;
• Facilitating vertical specialization in technology markets;
• Creating a platform for nancial investments in innovation;
• Supporting entrepreneurial liquidity through mergers, acquisitions, and IPOs;
• Supporting licensing-based technology business models; and
• Enabling a more ecient market for trading in technology and know-how.
All of these mechanisms combine to determine the value of IP to individuals and rms and the
contribution of IP to the economy. Analyzing and measuring all the ways in which IP impacts
the economy is beyond the scope of any individual report. However, a number of studies quanti-
fying the economic impact of IP-intensive rms have emerged since the publication of the 2012
report. We are encouraged to see continued interest in research that builds upon, challenges, and
provides alternative methodologies to the 2012 report.
is section reviews a selected group of studies that targeted similar research questions to the
2012 report and which were published aer that time. e European Patent Oce and the Oce
for Harmonization in the Internal Market (OHIM) published a comparable report in 2013 using
European Union (EU) data.
5
6
It relies on similar methodologies to identify intellectual proper-
ty rights (IPR) intensive industries in Europe and quanties their contribution to the European
economy in the 2008–2010 period. e study nds that IPR-intensive industries generated €4.7
trillion worth of economic activity, which amounted to almost 39% of EU GDP. Furthermore, the
study nds that IPR-intensive industries directly employed 56.5 million Europeans, which ac-
counted for almost 26% of all jobs for the period. e similarity in the ndings serves to further
reinforce the core message of the 2012 report that IP-intensive industries are an integral part of
the economy.
While these reports quantify the contribution of IP-intensive industries in the economy, there is
justied skepticism as to how accurately the employment and value added outcomes can be at-
5 AsofMarch2016,OHIMisknownastheEuropeanUnionIntellectualPropertyOfce.
6 EPO and OHIM 2013.

InellecualProperandheUSconomUpdae
tributed to IP itself. For example, the fact that we observe signicant employment in IP-intensive
industries does not inform us about the contribution of IP to economic growth because employ-
ment in non-IP-intensive industries is a viable alternative. e reports also study the wage dier-
entials between IP-intensive and non-IP-intensive industries. Both reports show that IP-intensive
industries pay higher wages than other industries. While this wage premium is noteworthy, we
cannot conclude that the wage dierential is due to IP.
In 2015, OHIM issued a second report, relying on rm-level data to compare rms that own
IPRs to those that do not.
7
e report considers a representative sample of over 130,000 Euro-
pean rms and studies their economic outcomes, taking into account whether they own patents,
trademarks, or designs. e study nds that IPR-owning rms earn, on average, 29 percent more
in revenue per employee and pay, on average, 20 percent more in wages. is dierence is even
more signicant for small and medium enterprises that own IPRs as they earn 32 percent more
in revenue, on average, per employee compared to their counterparts with no IPRs. While this
study does not identify the causal impact of IPRs, it provides detailed evidence of a high correla-
tion between IPR-ownership and economic performance.
e methodology in the 2015 OHIM study addresses a limitation in the way the earlier reports
dened IP-intensive industries. e previous reports measure IP-intensity at the industry-level
based on the aggregate volume of IP relative to employment. ey then designate an industry
as IP-intensive or non-IP-intensive based on whether the IP to employment ratio falls above or
below the average for all industries. ere are reasonable, alternative measures of IP intensity;
including a ratio of IP to gross output, research and development, or value added. But data lim-
itations, such as data sensitivity and the absence of legal requirements on producers to record
and report on internal activities, preclude access to data at the level of detail needed to systemat-
ically employ such measures. e 2015 OHIM report successfully overcomes these limitations by
developing detailed IP-to-rm data necessary for conducting a disaggregated analysis comparing
IPR-owning with non-IPR-owning rms in Europe.
USPTO and U.S. Census researchers have recently constructed patent-to-rm data to enable
similar analysis for the U.S.
8
e authors match data on owners and inventors of U.S. patents
issued between 2000 and 2011 to U.S. Census Bureau data on rms and workers. Using this com-
prehensive database, the authors analyze patent-intensive rms and their contribution to the U.S.
economy. ey nd that patenting rms represent only 1 percent of U.S. rms (2000–2011) but
are among the largest in the economy, accounting for 33 percent of employment. Patenting rms
create more jobs than their non-patenting counterparts of the same age across all age categories
except the very youngest (rms <1 year old). e authors also nd that most patenting rms are
small businesses. But, because they patent less frequently, the majority of U.S. patents are held by
a few large, prolic patenting rms. Lastly, they nd that while the manufacturing sector is par-
7 OHIM 2015.
8 Graham et al. 2015.

InellecualProperandheUSconomUpdae
ticularly patent intensive with more than 6 percent of rms owning a patent between 2000 and
2011, the majority of patenting rms are in the services and wholesale sectors.
A handful of recent academic papers have also attempted to measure the impact of IP on rm
performance. One recent notable contribution uses detailed USPTO data to study whether pat-
ents have a causal impact on the growth potential of startups.
9
e authors nd that patents do in
fact “help startups create jobs, grow their sales, innovate, and eventually succeed” and that a delay
in a patent grant can retard the benet of each of these.
10
11
Another line of research uses surveys to study the role that IP plays in the economic performance
of rms as well as their innovative eorts. A recent study surveys over 6,000 American manufac-
turing and service sector rms to evaluate the extent to which rms that introduce new products
in the market outsource innovation to specialized rms. It nds that between 2007 and 2009, 16
percent of manufacturing rms introduced a new product in their industry. Of these innovators,
42 percent reported patenting their most signicant new product, though there is considerable
variation across industries and rms. More R&D-intensive industries, i.e., those with above
average share of rms investing in R&D, tend to patent new products at higher than average
rates. Roughly 63 percent of large manufacturing rms reported patenting their most signicant
new product innovation, compared to only 47 percent of medium rms and 36 percent of small
rms.
12
e UK Intellectual Property Oce published another survey based study in 2012 that aims to
quantify the extent to which patents increased expenditure in R&D. Using data from the UK in-
novation survey and linked data on rm performance, the authors estimate the patent prot pre-
mium, meaning the additional returns to R&D that can be attributed to patent protection.
13
ey
nd that patent premiums are positive and provide incentives to invest in R&D, though estimates
vary by type of rm and industry. Estimated patent premiums are lower for smaller rms and
rms outside biotech and pharmaceutical industries. However, premium and incentive eects are
comparable for young and older rms, indicating that patent protection can incentivize R&D for
new as well as established innovators.
9 Farre-Mensa et al. 2016. By employing an instrumental variables approach, the authors are able to identify a causal
relationship, as opposed to a mere correlation.
10 Ibid., 2.
11 Note that some startups may prefer a delay in patent grant because a larger share of its overall economic value may be
realized later in the patent term or during the period of time that is accrued due to patent term adjustment.
12 Arora et al. 2016.
13 Arora et al. 2012.

InellecualProperandheUSconomUpdae
Taken together, these contributions signicantly advance our knowledge about the role of IP in
the economy. An important direction of future work is exploiting even more granular data and
seeking methods to identify causal links between IP and economic performance. Survey based
studies, which can be designed to target specic research questions, will also continue to improve
our understanding about the extent to which IP contributes to the economy. And it is critical that
policy-makers consider scientic research standards when evaluating evidence with policy mak-
ing implications.

InellecualProperandheUSconomUpdae
III. Ideniing IP-Inensie indusries
As in the 2012 report, IP-intensity for an industry is dened as the count of its intellectual prop-
erty for a given period of time relative to the industry’s total employment. An industry is desig-
nated as IP-intensive if its IP-count to employment ratio is higher than the average for all indus-
tries considered. Dividing IP-counts by employment is one approach to adjust for dierences in
industry size, which makes industries more comparable. However, there are other alternatives.
For instance, IP-counts could be normalized by capital holdings, research and development ex-
penditures, value added, or gross output. In addition, other methods are available for dierenti-
ating between IP-intensive and non-IP-intensive industries.
14
To maintain consistency and allow
comparisons to the 2012 report, this update follows the methodologies applied previously but
expands coverage to the 2009–2013 period.
15
Paens
e USPTO grants utility, plant, and design patents that give the grantee the right to exclude
“others from making, using, oering for sale, or selling the invention throughout the United
States or importing the invention into the Unites States.”
16
Using the U.S. Patent Classication
(USPC) scheme, patents are classied in over 450 patent “technology classes” that distinguish
their inventive content.
17
18
e USPTO maintains a general concordance between its technology
classications and 30 North American Industry Classication (NAICS) codes. e concordance
enables analysts to associate utility patents with these NAICS coded industries.
19
We rely on
NAICS-based patent counts for 2009 to 2013 to identify patent-intensive industries.
20
is ap-
proach strictly limits the patent analysis to the manufacturing sector because the concordance
only associates patents with manufacturing industries. Non-manufacturing industries, such as
construction, utilities, and information, may rely on utility patents, but these industries are not
captured by the patent-NAICS concordance. We calculate a measure of industry patent “intensity”
dened as the ratio of total patents over the ve years in a NAICS category to the average payroll
14 For example, analyzing the differences by deciles or even evaluating a continuous function are possible alternative
approaches that may prove informative.
15 Detailed description of the methodology is provided in the Appendix.
16 35 U.S.C. § 154(a)(1).
17 Utilitypatentsmaybeclassiedintomorethanonetechnologyclassbutareorganizedaccordingtotheirprimaryclas-
sication.
18 Whileitdoesnotaffectanyoftheresultsinthisreport,itisworthnotingthatofcialuseoftheUSPCwasdiscontin-
uedinJanuaryof2015.PatentsarenowclassiedusingtheCooperativePatentClassication(CPC)scheme.
19 ThisconcordancewascreatedbytheUSPTOwithnancialsupportfromtheNationalScienceFoundation.Becauseno
similar concordances to NAICS are available for plant or design patents, only utility patents are used in our analysis.
Seewww.uspto.gov/web/ofces/ac/ido/oeip/taf/all_tech.htmformoreinformationonutilitypatents.Foranoverview
of NAICS, see www.census.gov/eos/www/naics/index.html.
20 Seewww.uspto.gov/web/ofces/ac/ido/oeip/taf/data/misc/patenting_trends/info_ptrends2008.txt.

InellecualProperandheUSconomUpdae
employment by industry.
21
Because employment reects the overall size of an industry, dividing
patent counts by employment normalizes patenting activity with respect to industry size.
22
is
approach evens the playing eld, so that the most patent-intensive industries are dened not as
the ones with the most patents, but rather as those with the most patents per worker.
Nearly all the industries identied as patent-intensive in the 2012 report are also designated as
such for the 2009–2013 period. One industry, resin, synthetic rubber, bers, and articial and
synthetic bers and laments (NAICS 3252), did not make the cuto in the current report. In
addition, some changes occurred in the rank-order of these industries. For example, semiconduc-
tor and other electronic components (NAICS 3344) was previously designated as the third most
patent-intensive industry, but dropped to h place. However, based on the close similarity in
the list and rank-order of patent-intensive industries across reports, it appears that patent-inten-
sity at the industry level is quite persistent over time.
23
rademars
A trademark is dened as “a word, phrase, symbol, or design, or a combination thereof, that iden-
ties and distinguishes the source of the goods of one party from those of others.”
24
rough ex-
clusive rights of use, trademarks confer legal protection that enables companies to communicate
to consumers the quality characteristics of their products and services and recoup investments
therein.
As in the 2012 report, this study uses three dierent approaches to identify trademark-intensive
industries.
25
e rst approach, as with patents, measures the trademark-intensity of an industry
based on the ratio of trademark counts to employment and designates those industries with an
above average ratio as trademark-intensive. Starting with the complete set of trademark regis-
trations, we matched publicly traded companies by their name to a separate database containing
information on the rms’ primary industry and number of employees. ese data allowed us to
calculate trademark intensity by industry for the matched rms. e second approach uses the
USPTO’s listing of top 50 trademark registering companies (which, unlike the rst approach,
include both private and public companies) from the Performance and Accountability Reports
for 2009–2013 and identies industries that appear repeatedly as trademark-intensive. To expand
coverage for privately-held companies and for smaller and younger rms, the third approach
draws a random sample of 300 registrations from the 194,326 trademark registrations in 2013.
We assign NAICS industry codes to the U.S. registrants in the sample and calculate the industry
share of total registrations, labeling those with an above average share as trademark-intensive.
21 Usingave-yearperiod(inthiscase,years2009–13)insteadofjustoneyearhelpsminimizethechancethatanoma-
lies in any given year will skew our results.
22 Value added and gross output are two alternative gauges of industry size; however, estimates at the level of detail need-
edforthisanalysisarenotavailableduetodatacondentialitylimitations.
23 A detailed discussion of the methodology and a table of results are provided in the Appendix.
24 U.S.PatentandTrademarkOfce2016.Weusethetermtrademarktoencompassbothtradeandservicemarks.
25 These methodologies are discussed in detail in the Appendix.

InellecualProperandheUSconomUpdae
We combine the results from each approach to form the nal group of trademark-intensive in-
dustries.
e results from these exercises, which are summarized in Tables A-6, are noteworthy in at least
two ways. First, the diversity of the industries listed as trademark-intensive is indicative of both
the spread and intensity of trademark use. Second, we observe signicant consistency across the
three methodologies in the industries designated as trademark-intensive; which provides some
evidence on the validity of these approaches.
For robustness, we also compare the nal group to the industries covered by the companies in In-
terbrand’s listing of Best Global Brands in 2013.
26
As discussed in the Appendix, these two groups
overlapped signicantly further corroborating our ndings.
Coprighs
e 1976 Copyright Act of the U.S. states that copyright protects “original works for authorship
xed in any tangible medium of expression, now known or later developed, from which they
can be perceived, reproduced, or otherwise communicated, either directly or with the aid of a
machine or device.”
27
Copyright-intensive industries were rst dened by the World Intellectual
Property Organization’s (WIPO) Guide on Surveying the Economic Contribution of the Copy-
right-based industries and subsequently applied to the U.S. Economy.
28
As in the 2012 report,
this update uses a narrower denition of copyright-intensive industries than WIPO, focusing
on industries that produce creative works and excluding several industries associated with the
distribution of copyrighted material. We dene copyright-intensive industries as those primarily
responsible for the creation or production of copyrighted materials. is group includes nearly all
industries traditionally associated with production of creative works.
29
26 Interbrand 2013.
27 17 U.S.C § 102(a).
28 World Intellectual Property Organization 2003. See, for example, Siwek 2009.
29 A more detailed description of our methodology is provided in the Appendix.
InellecualProperandheUSconomUpdae
IV. IP-Inensie Indusries in he conom
mplomen
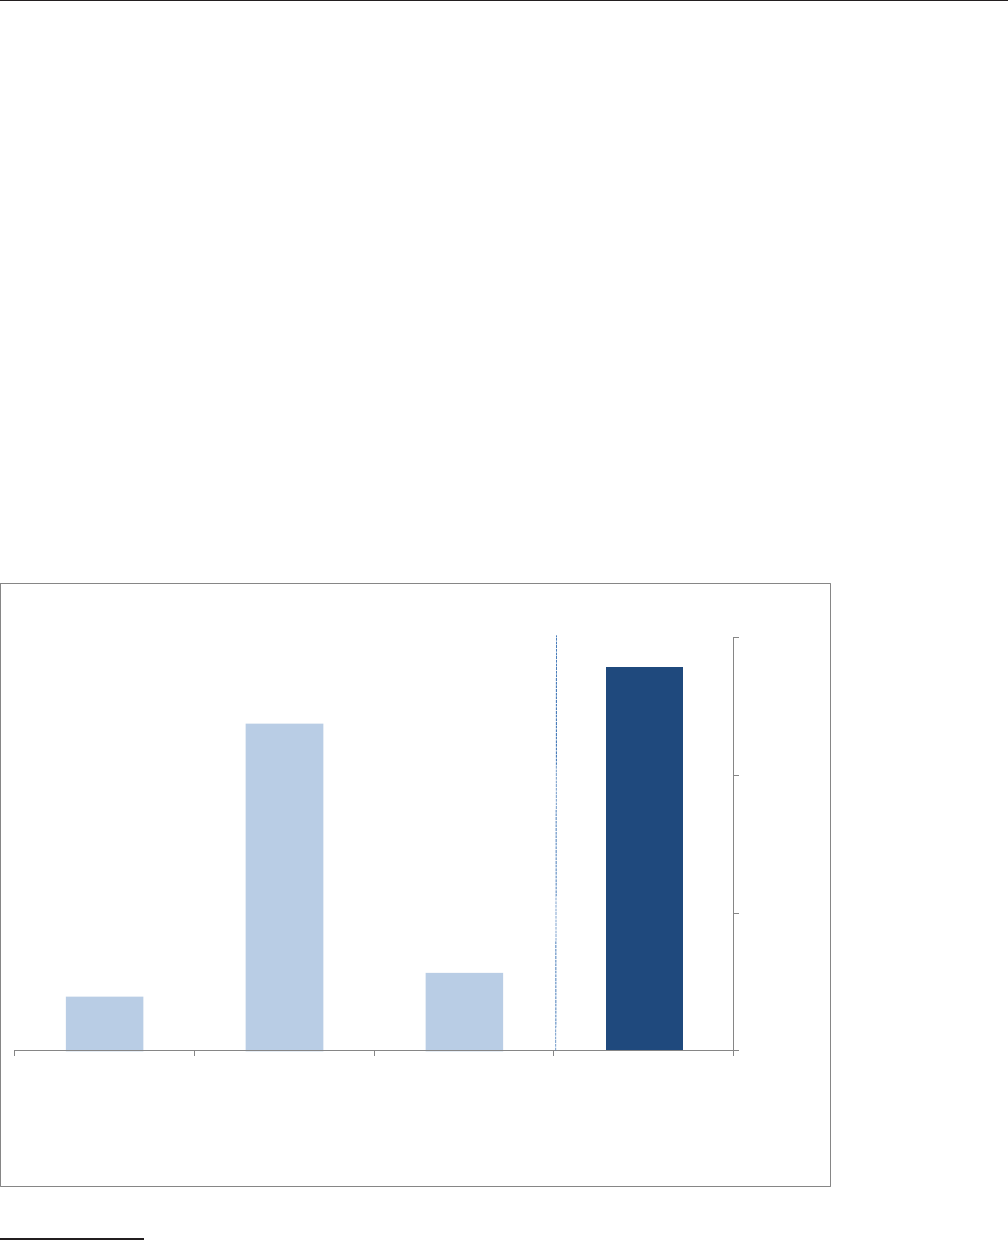
Employment in IP-intensive industries totaled 27.9 million in 2014, representing 18.2 percent
of all jobs in the economy (See Figure 1). Since the 2012 report, employment in IP-intensive
industries has generally increased, rising from 27.1 million in 2010. However, due to employ-
ment growth in non-IP-intensive industries, IP-intensive industries account for a slightly lower
overall percentage of U.S. jobs (down from 18.8 percent in 2010). As in the 2012 report, trade-
mark-intensive industries contribute the most to employment. ese industries accounted for
23.7 million jobs in 2014 (up from 22.6 million in 2010), or 85 percent of all IP-intensive jobs (up
from 83 percent in 2010).
30
Copyright-intensive industries supplied 5.6 million jobs (compared
to 5.1 million in 2010) followed by patent-intensive industries with 3.9 million jobs (3.8 million
in 2010). Twenty-three of the 81 industries considered in this report were intensive in more than
one form of IP protection. For instance, Audio and Video Equipment Manufacturing (NAICS
3343) is both patent-intensive and trademark-intensive. ese multi-intensity industries account-
ed for 5.5 million jobs (up from 4.5 million jobs for 24 industries in 2010).
31
3,927
23,741
5,672
27,877
0
10,000
20,000
30,000
Patent-intensive Trademark-intensive Copyright-intensive IP-intensive
Jobs in thousands
Figure 1. Employment in IP-Intensive Industries, 2014
Source: ESA calculations using data from the Bureau of Labor Statistics' Industry Productivity program.
Note: Estimates include wage and salary employment, the self-employed, and unpaid family workers. Because several industries
were found to be trademark-intensive and patent- or copyright-intensive, total employment in IP-intensive industries is less
than the sum of employment in patent-, trademark-, and copyright-intensive industries.
30 The fact that 66 out of the 81 IP-intensive industries are trademark-intensive industries likely explains why these
industries continue to account for a large majority of IP-intensive industries employment.
31 Because some industries are intensive in more than one form of IP, the sum across the individual groups is larger than
thetotalforIP-intensiveindustries.The5.5milliongurecanbecalculatedbysubtractingoverallIPintensiveem-
ployment from the sum of employment of trademark, patent, and copyright intensive industries.
InellecualProperandheUSconomUpdae
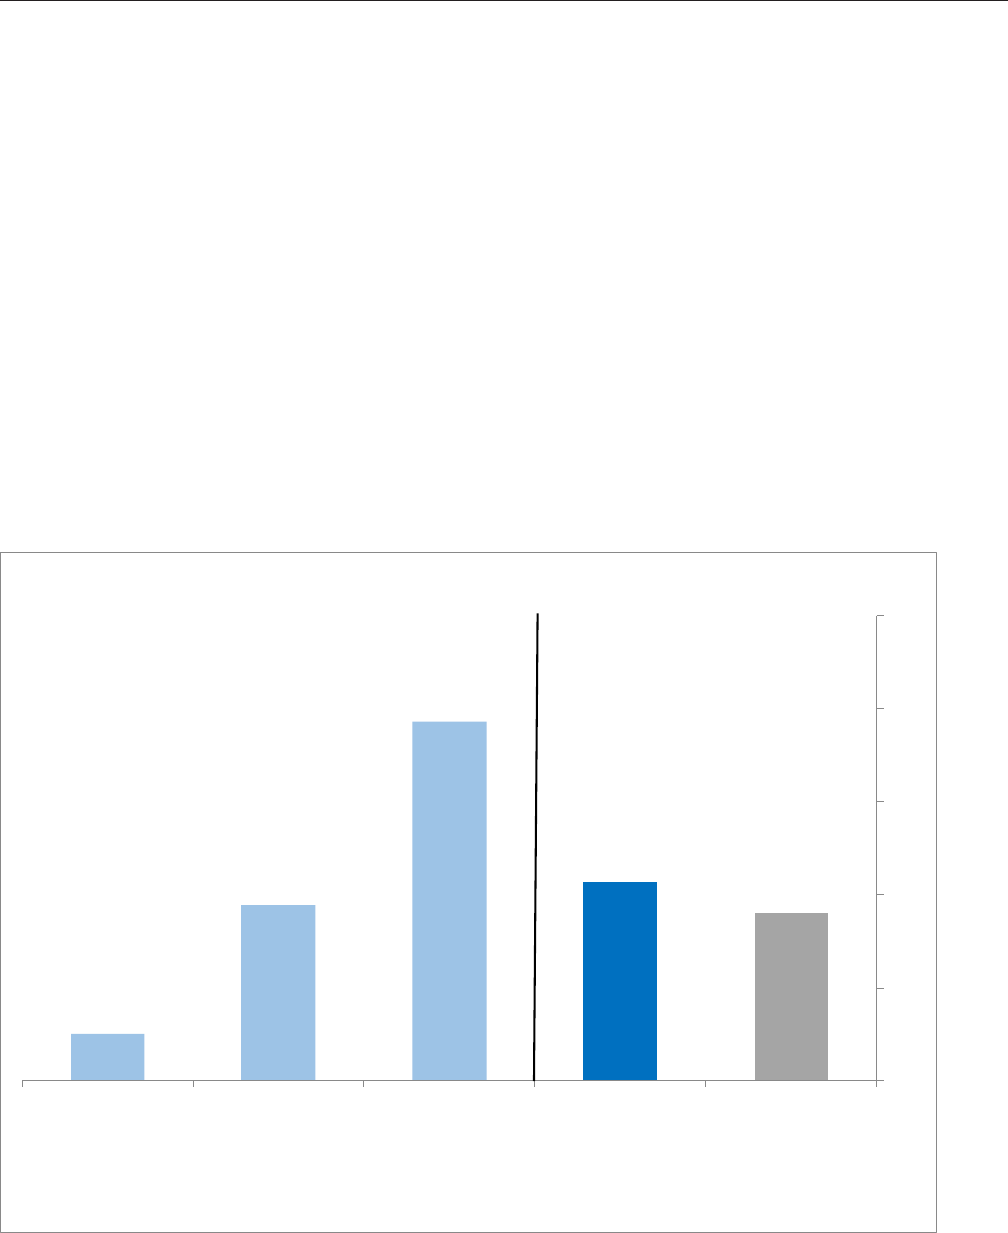
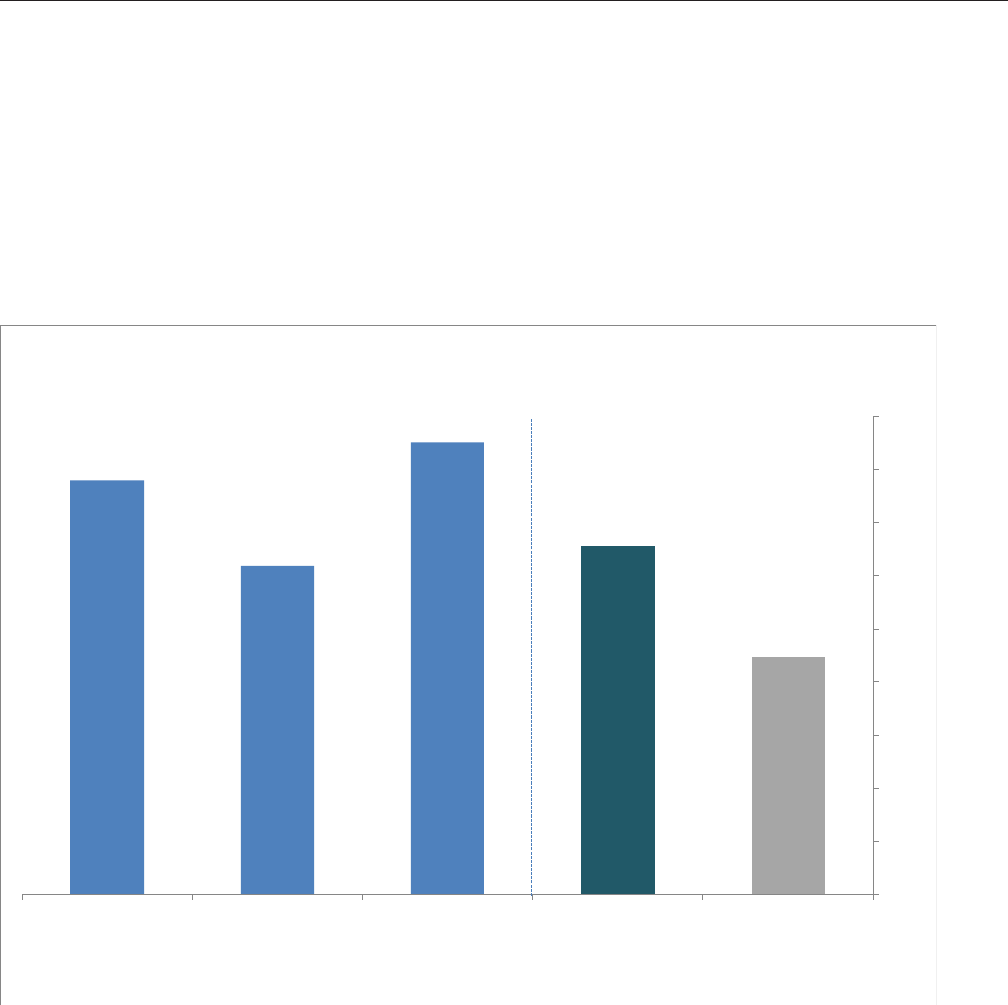
Self-employed individuals make up a signicant portion of jobs in IP-intensive sectors, partic-
ularly in copyright-intensive industries. Self-employed individuals accounted for 2.4 million
jobs in 2014 (unchanged from 2010); which amounts to 8.5 percent of IP-intensive industries
employment (compared to 8.9 percent in 2010). By contrast, the self-employed share of jobs in
non-IP-intensive industries dropped to 7.2 percent in 2014 from 8.8 percent in 2010
(See Figure 2).
At the individual IP level, the share of self-employed has exhibited relatively small changes since
2010. Trademark-intensive industries increased their share from 7.3 percent in 2010 to 7.6 per-
cent in 2014, while patent- and copyright-intensive industries dropped to 2.0 percent (from 2.2
percent) and 15.4 percent (from 16.5 percent), respectively. e fact that copyright-intensive
industries continue to have the highest self-employment share is not surprising as many jobs
in the creative and performing arts are contract rather than payroll jobs, usually related to the
completion or performance of a specic authored work. However, it should also be noted that
trademark-intensive industries continue to have the largest number of self-employed persons at
1.8 million.
2.0%
7.6%
15.4%
8.5%
7.2%
0%
4%
8%
12%
16%
20%
Patent-intensive Trademark-intensive Copyright-intensive IP-intensive Non-IP-intensive
Figure 2. Self-Employed Share of All Jobs in IP-Intensive Industries, 2014
Source: ESA calculations using data from the Bureau of Labor Statistics' Industry Productivity program.
Note: Estimates show the self-employed and unpaid family workers as a share of all jobs. However, unpaid family workers account for
only about one percent of the combined total of the self-employed and unpaid family workers outside of agriculture.
The IP-intensive bar on the right represents all IP-intensive (patent-, trademark- and copyright-intensive) industries.
InellecualProperandheUSconomUpdae
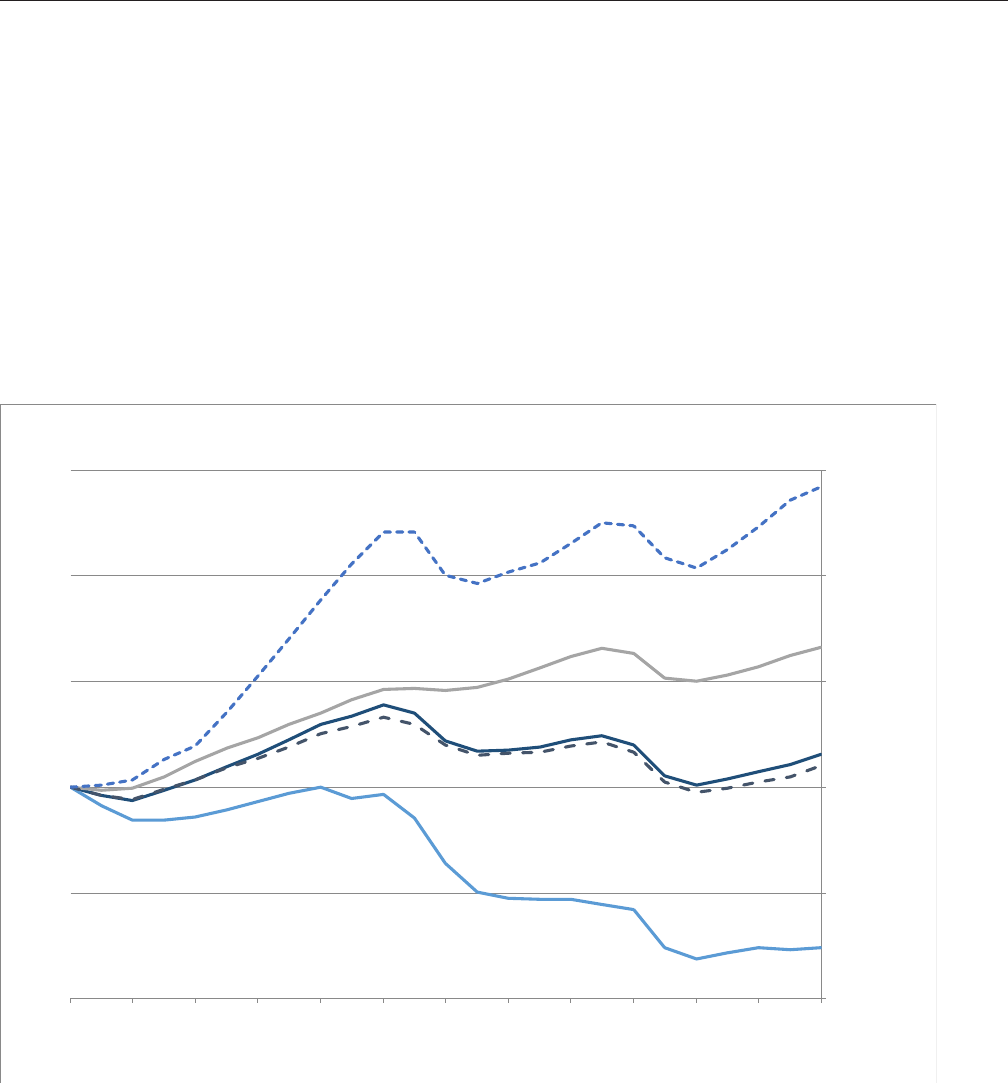
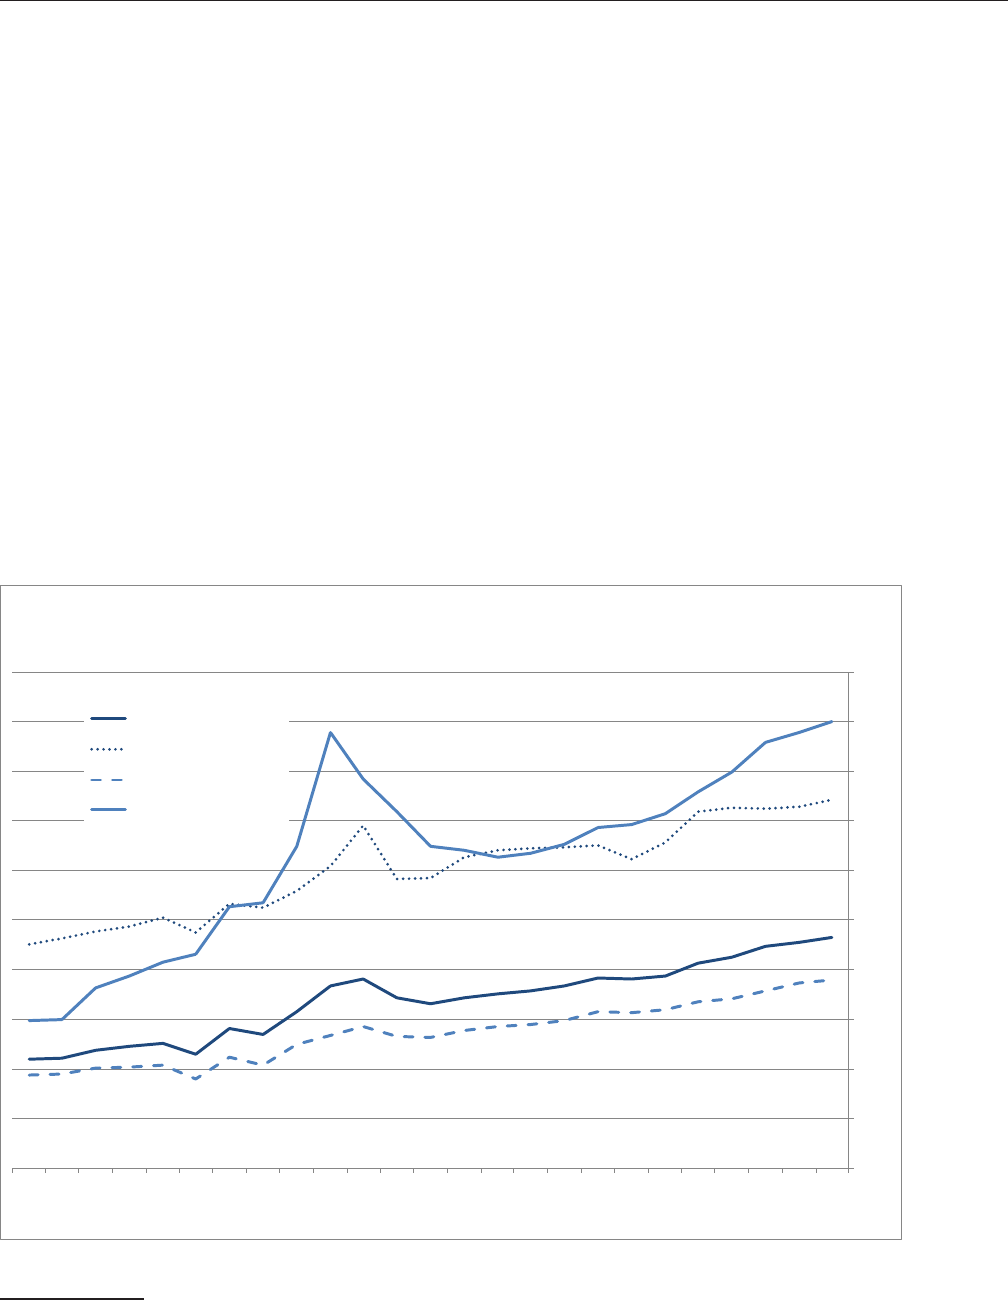
Figure 3 shows the trends in employment growth across IP and non-IP-intensive industries over
the past twenty-ve years. As noted in the 2010 report, employment in IP-intensive industries
was nearly the same in 2010 as in 1990 because considerable growth in employment during the
1990s was largely reversed in the 2000s. Since 2010, however, jobs in these industries rebounded.
From 2010 to 2014, IP-intensive industry employment grew 6 percent, driven by trademark and
copyright-intensive industries. Patent-intensive industries showed moderate job growth follow-
ing the Financial Crisis, but this may reect the fact that patent-intensive industries are restricted
to manufacturing. Since 2010, employment in non-IP-intensive industries outpaced that of IP-in-
tensive industries by 2 percentage points. As a result, the share of total employment in IP-inten-
sive industries edged down over the past two and half decades from 21.0 percent in 1990 to 20.6
percent in 2000 and 18.2 percent in 2014.
60
80
100
120
140
160
1990 1992 1994 1996 1998 2000 2002 2004 2006 2008 2010 2012 2014
1990 = 100
Figure 3. Indexed Employment in IP-Intensive Industries, 1990-2014
Copyright-intensive
Non-IP-intensive
IP-intensive
Trademark-intensive
Patent-intensive
Source: ESA calculations using data from the Bureau of Labor Statistics' Industry Productivity program.
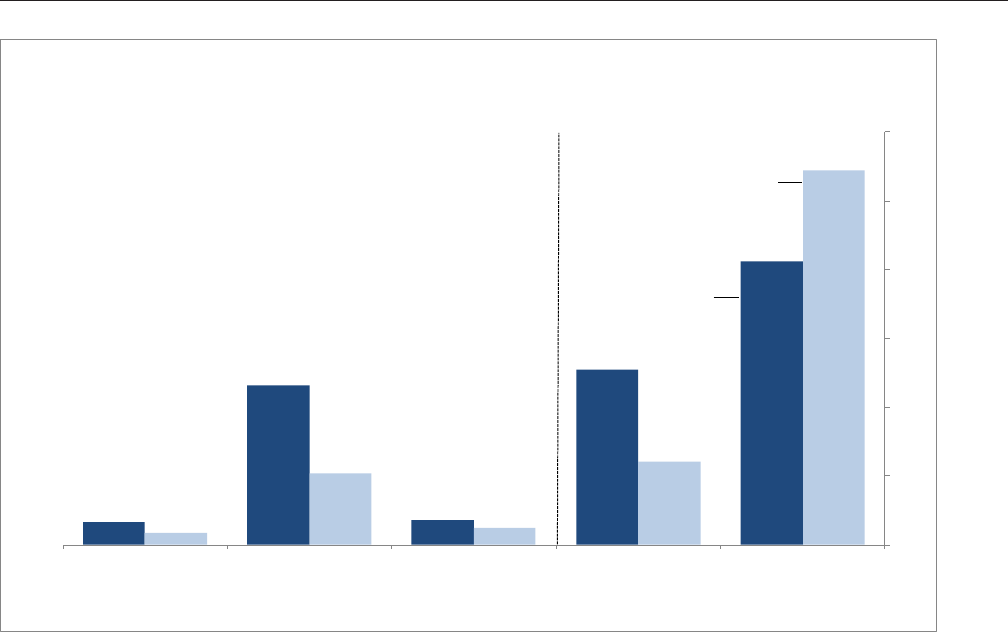
oal mplomen Suppored b IP-inensie Indusries
While IP-intensive industries directly accounted for 27.9 million jobs either on their payrolls
or under contract in 2014, they also helped to support an additional 17.6 million jobs in other
(non-IP-intensive) industries that supply them goods and services (i.e. the supply chain). Taken
InellecualProperandheUSconomUpdae
together, IP-intensive industries directly and indirectly supported 45.5 million jobs, about thirty
percent of all employment.
32
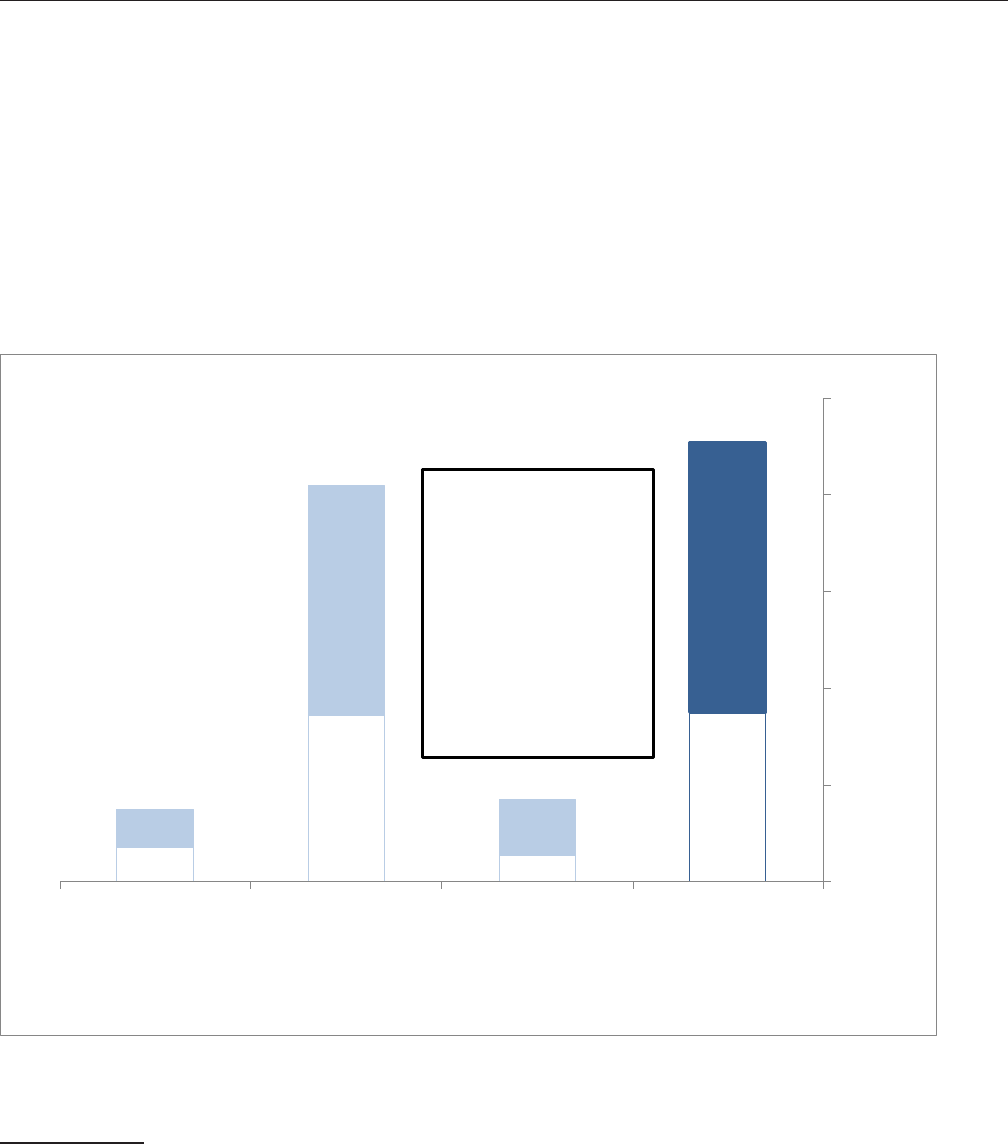
Figure 4 shows direct employment in IP-intensive industries (medium blue bar) along with in-
direct employment in the supply chain (the rectangle below the blue bar). Indirect employment
increased for all IP-intensive industries with trademark-intensive industries growing the most
since 2010. Trademark-intensive industries indirectly employed 17.3 million jobs in 2014, up
from 13.1 million in 2010. Copyright-intensive industries supported an additional 2.8 million
jobs indirectly in 2014, compared to 2.5 million in 2010. Patent-intensive industries indirectly
supported 3.5 million jobs, up slightly from 3.3 million in 2010.
3,507
17,307
2,809
17,602
3,988
23,741
5,733
27,877
7,495
41,048
8,542
45,478
0
10,000
20,000
30,000
40,000
50,000
Patent-intensive Trademark-intensive Copyright-intensive IP-intensive
Jobs in Thousands
Figure 4. Total Employment Supported by IP-Intensive Industries, 2014
Total employment
supported by the
IP-intensive industries
=
Jobs in patent,
trademark, copyright, or
IP-intensive industries
+
Supply-chain jobs
in other industries
Source: ESA calculations using data from the Bureau of Economic Analysis' Industry Accounts office and the Bureau of
Labor Statistics' Industry Productivity program.
Note: Estimates include wage and salary employment, the self-employed, and unpaid family workers. Because several industries
were found to be trademark-intensive and patent- or copyright-intensive, total employment in IP-intensive industries is less than
the sum of employment in patent-, trademark-, and copyright-intensive industries.
32 These estimates are derived from unpublished input/output tables computed and analyzed by staff from the Bureau
ofEconomicAnalysis’IndustryAccountsofce.DataareconsistentwiththeDecember2010annualrevisiontothe
annualInput-Outputtablesandarebasedonthe2014after-redenitiondomesticmakeandusetablesandestimatesof
theshareof2014employmentattributabletonaldemandinIP-intensiveindustries.Totaloutputrequirementtables
were calculated based on the make and use table following the methodology published in the mathIO.doc, which are
available at www.bea.gov/industry/zip/cxctr2002detail.zip. In the previous report, non-IP employment was calculated
using employment data from BEA. In this update employment measures come from the Bureau of Labor Statistics’
IndustryProductivityprogram:http://www.bls.gov/lpc/lpc_hours_and_employment.xlsx.NAICScodesareconverted
toindustrycodesusing:http://www.bea.gov/industry/xls/GDPbyInd_VA_NAICS_1997–2012.xlsx.

InellecualProperandheUSconomUpdae
As in the 2012 report, patent-intensive industries rely more heavily on the supply chain as evi-
denced by a larger share of total jobs in indirect employment (47 percent) compared to trade-
mark- and copyright-intensive industries.
In addition to the indirect employment supported through the supply chain, IP-intensive indus-
tries also help support downstream businesses that facilitate the distribution and trade of goods
and services. If one were to include indirect employment in these businesses, total employment
supported by IP-intensive industries would be greater than the 45.5 million jobs mentioned
above.
InellecualProperandheUSconomUpdae
IP-Inensie Paroll Jobs b Sae
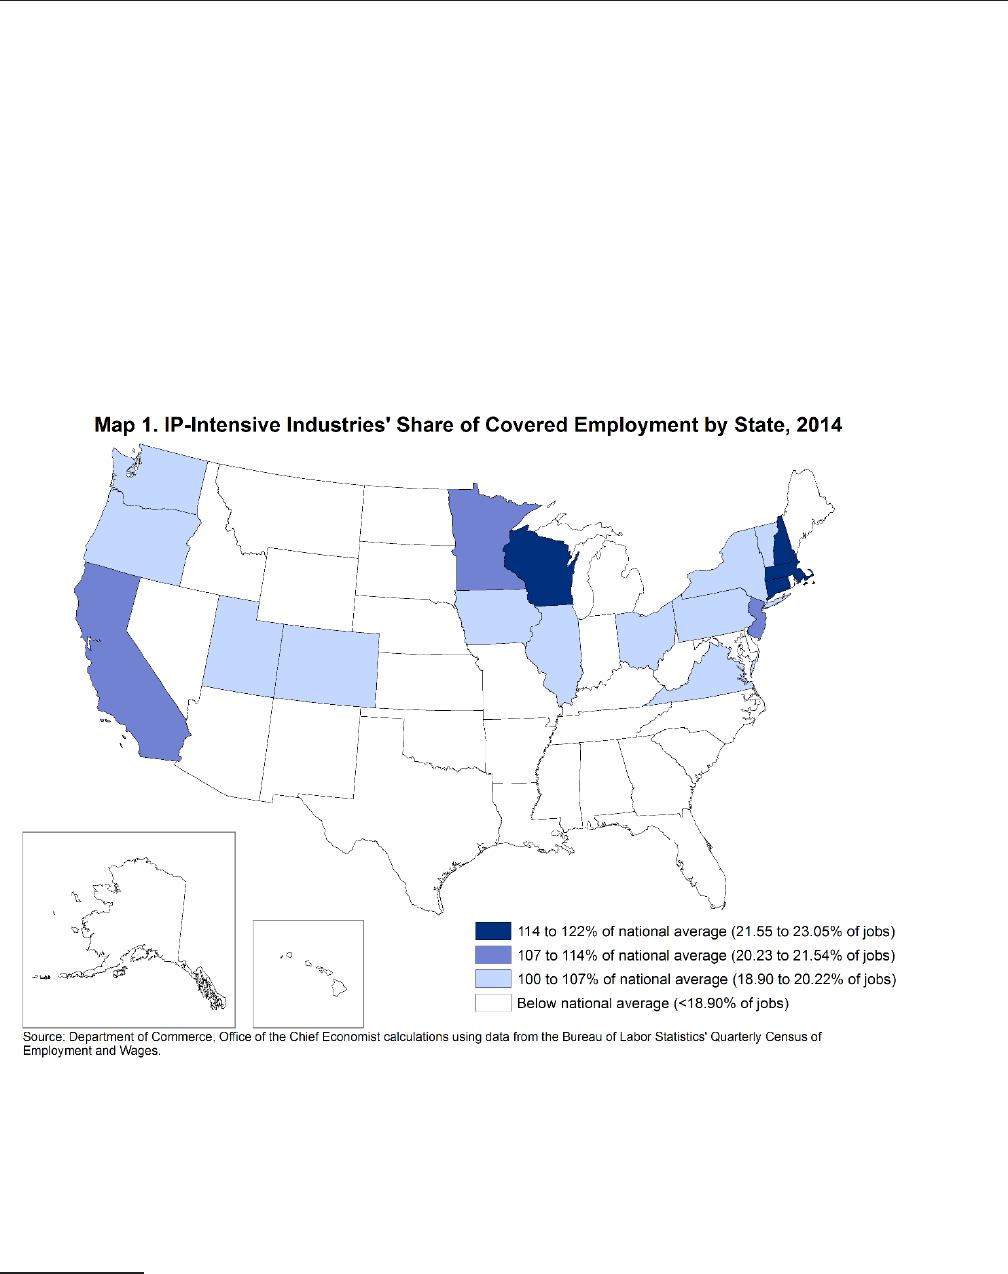
Employment in IP-intensive industries is not evenly distributed across states. Map 1 highlights
those U.S. states that are above the national average in terms of the share of covered employment
in IP-intensive industries.
33
Eighteen states (up from 16 in 2010) exceeded the national average
of 18.9 percent, which was 19.1 percent in 2010. With a few exceptions, IP-intensive states cluster
in New England, the upper Midwest, and West Coast. is is broadly similar to the distribution
reported in the 2012 report. e top ve states are also similar. In 2014, they were New Hamp-
shire (23.1 percent), Connecticut (23.0 percent), Wisconsin (22.5 percent), Massachusetts (21.9
percent), and Minnesota (21.2 percent). Vermont, which was part of the top ve in 2010, was
replaced by Minnesota.
33 The data used to examine state employment are from the Bureau of Labor Statistics’ Quarterly Census of Employment
and Wages (QCEW) and measure covered employment. Covered employment refers to jobs covered by state and fed-
eral unemployment insurance law, which represent practically all of civilian wage and salary employment. These data
do not include the self-employed or unpaid family workers. For more information on QCEW, see www.bls.gov/cew.
InellecualProperandheUSconomUpdae
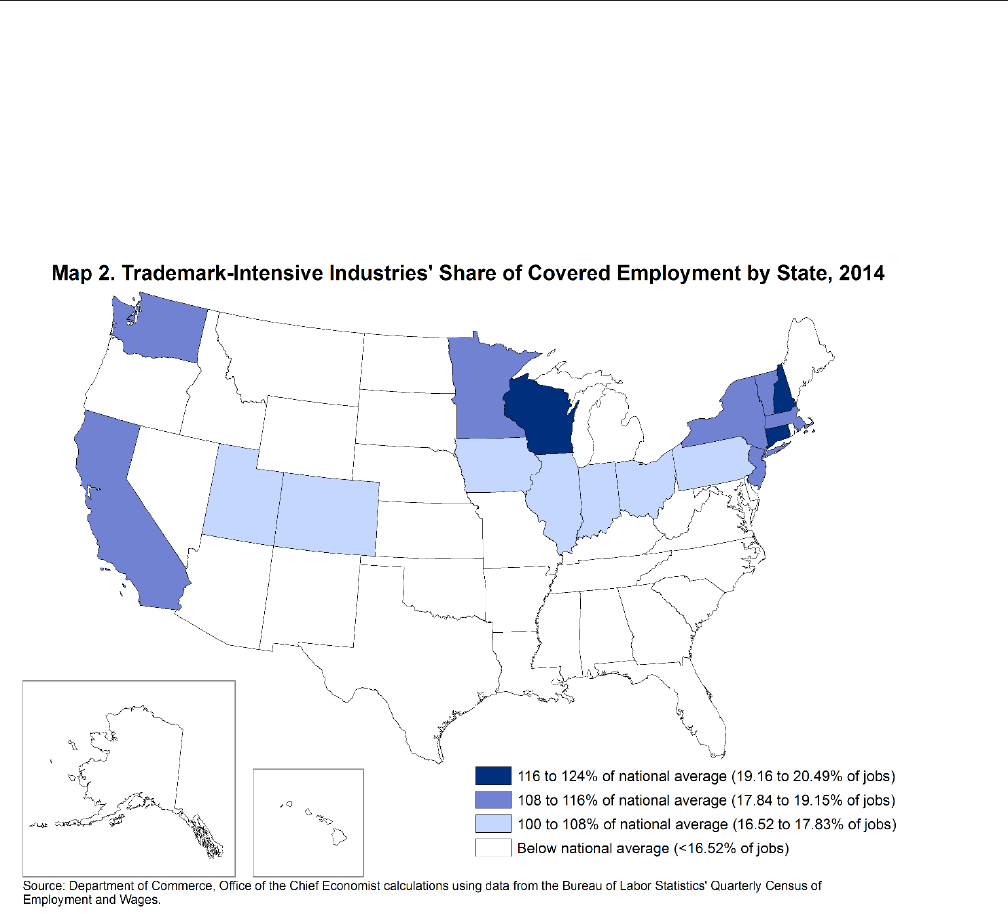
As seen in Map 2, the state distribution for trademark-intensive industries looks like what is ob-
served in Map 1 for all IP-intensive industries. Sixteen of the 18 states with above-average shares
of IP-intensive jobs also had above-average shares of trademark-intensive jobs. is reects the
contribution of trademark-intensive industries to IP-intensive jobs and the fact that 66 of the 81
IP-intensive industries were designated as trademark-intensive. Only Virginia and Oregon do not
show up as trademark-intensive employment states.
InellecualProperandheUSconomUpdae
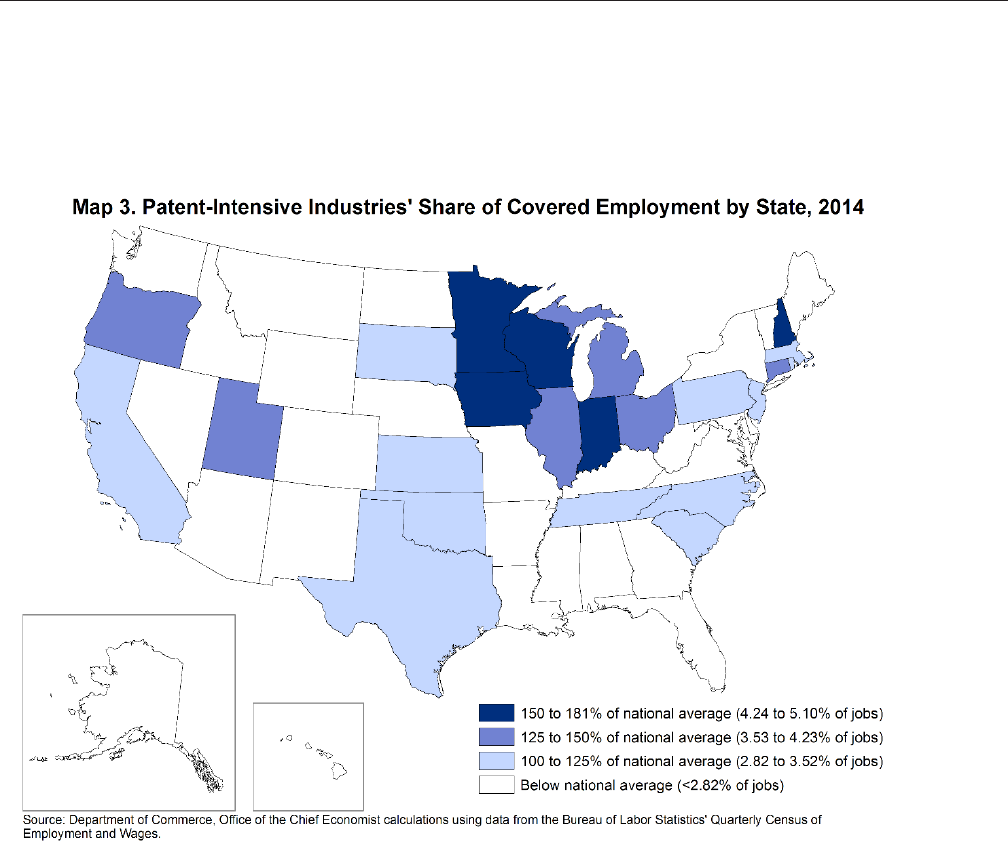
In 2014, 23 states had above-average shares of employment in patent-intensive industries, up
from 21 states in 2010 (See Map 3). Texas, Oklahoma, and Kansas were added in 2014 while Ver-
mont was removed. States in New England and the upper Midwest continue to have the highest
shares.

InellecualProperandheUSconomUpdae
For copyright-intensive industries in 2014, 14 states had above-average employment shares and
11 of these appeared on the 2010 list. Minnesota was removed from the list, while Illinois and
New Hampshire were added. As in the previous report, these states are mostly spread along the
East and West coasts. (See Map 4.)
Overall, ve out of the six states that had above-average employment shares for patent-, trade-
mark-, and copyright-intensive industries in 2010 also did in 2014. ese are California, Con-
necticut, Massachusetts, New Jersey, and Utah. Even more, Oregon and Washington became
IP-intensive states in 2014. e inclusion of Oregon is due to the increased share of its patent-in-
tensive industries while the inclusion of Washington is due to the increased share of its trade-
mark-intensive industries. ese results suggest the use of intellectual property is expanding
geographically.
InellecualProperandheUSconomUpdae
erage ages
Private wage and salary workers in IP-intensive industries continue to earn signicantly more
than those in non-IP-intensive industries. In 2014, the average weekly wage of $1,312 was 46
percent higher (up from 42 percent in 2010) than for workers in non-IP-intensive industries (See
Figure 5). While workers in non-IP-intensive industries earned $896 per week, those in patent-
and copyright-intensive industries earned $1,560 and $1,701 per week, respectively. At $1,236 per
week, workers in trademark-intensive industries earned less than their counterparts in patent-
and copyright-intensive industries, but still 38 percent more than non-IP-intensive workers.
$1,560
$1,236
$1,701
$1,312
$896
$0
$200
$400
$600
$800
$1,000
$1,200
$1,400
$1,600
$1,800
Patent-intensive Trademark-intensive Copyright-intensive IP-intensive Non-IP-intensive
Figure 5. Average Weekly Wages of Private Wage and Salary Workers in
IP-Intensive Industries, 2014
Source: ESA calculations using data from the Bureau of Labor Statistics' Quarterly Census of Employment and Wages.
InellecualProperandheUSconomUpdae
Figure 6 plots the trends in wage premiums for workers in IP-intensive industries.
34
With some
notable volatility, these premiums have generally increased. In the decade aer 1990, the premi-
um for workers in IP-intensive jobs increased from 22 to 38 percent. It lost some ground early in
the 2000s but has been rising steadily since 2002. By 2014, the IP-intensive industry wage pre-
mium stood at 46 percent. e trademark-intensive industry subgroup followed a similar path.
In 1990, trademark-intensive industries paid 19 percent more with this premium climbing to
29 percent by 2000 and 38 percent by 2014. Wages in the patent-intensive industries started at a
45 percent premium and grew through the 1990s before surging up to 69 percent by 2000. is
surge was reversed in 2001 and held fairly at in the last decade before rising again since 2008. In
2014, the average wage premium for patent-intensive workers was 74 percent.
e wage premium in copyright-intensive industries experienced a more extreme version of the
trends discussed above. In 1990, workers in these industries earned 30 percent more than non-IP
intensive industry workers, on average. is premium tripled during the following decade to 88
percent by 1999. Over the next ve years, it decreased to 63 percent before growing again to 90
percent by 2014. e wage premium for all four sets of industries was higher in 2014 than at any
point over the prior 24 years.
0%
10%
20%
30%
40%
50%
60%
70%
80%
90%
100%
1990 1992 1994 1996 1998 2000 2002 2004 2006 2008 2010 2012 2014
Figure 6. Average Weekly Wage Premium of Workers in IP-Intensive
Industries Relative to Non-IP-Intensive Industries, 1990-2014
IP-intensive
Patent-intensive
Trademark-intensive
Copyright-intensive
Source: ESA calculations using data from the Bureau of Labor Statistics' Quarterly Census of Employment and Wages.
34 The wage premium measures the percentage difference between the wages of workers in IP-intensive industries versus
those in non-IP-intensive industries. It is a premium because average weekly wages are higher in IP-intensive indus-
tries.
InellecualProperandheUSconomUpdae
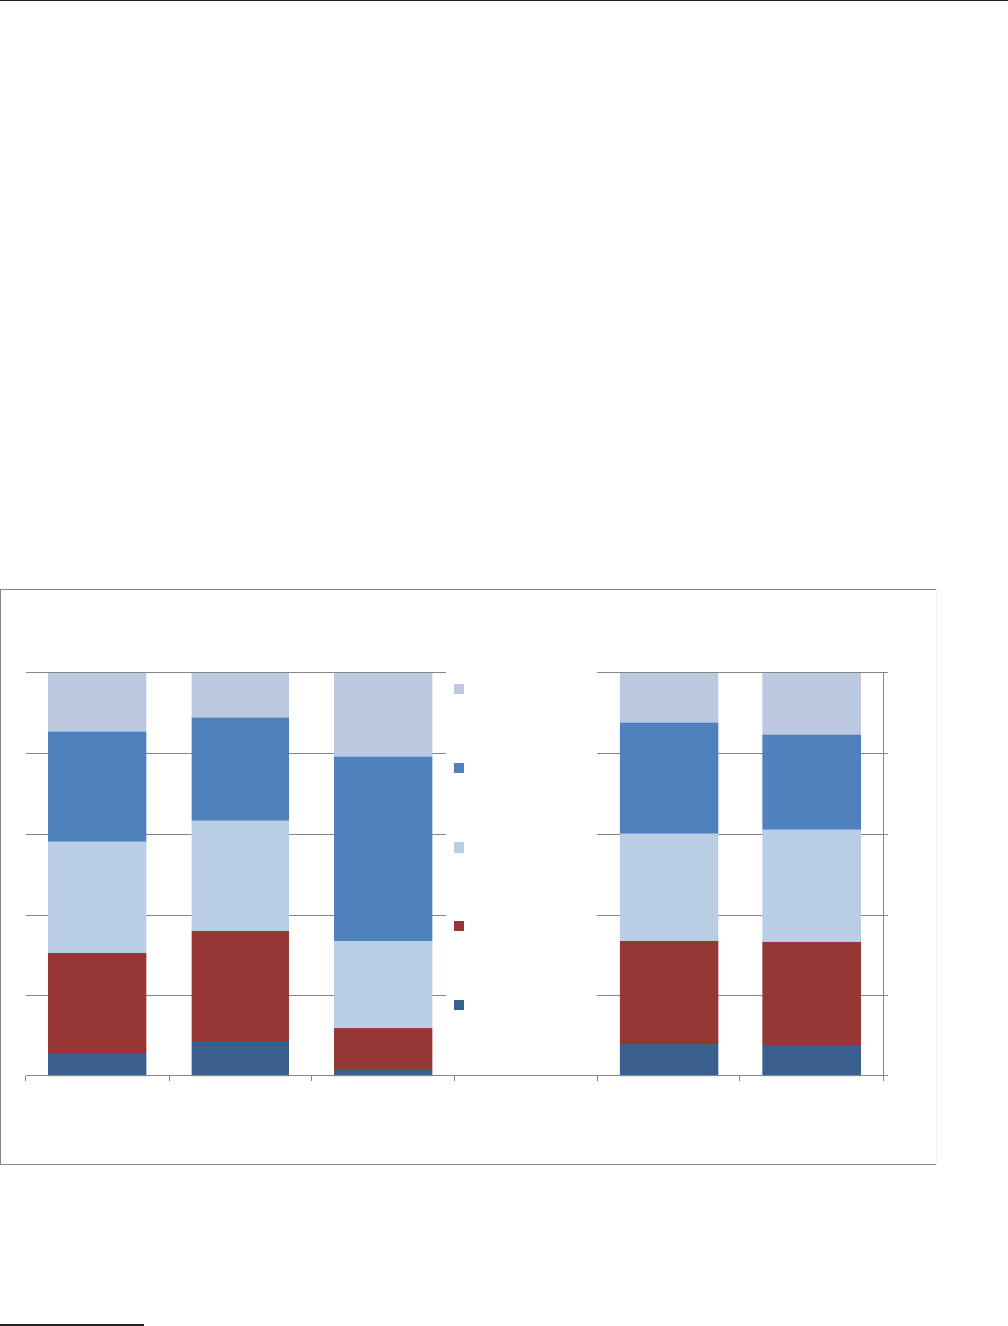
ducaion
In competitive labor markets, wages are closely correlated to worker productivity, and education-
al attainment is a common gauge of workers’ skill and expected productivity. us, we expect
employees in IP-intensive industries to have relatively high educational attainment. e 2010
data were consistent with this hypothesis as 42.4 percent of workers age 25 and older in IP-inten-
sive industries had a bachelor’s degree or higher, compared with 34.2 percent in private non-IP
intensive industries.
35
However, data from the 2015 Current Population Survey show this edu-
cation gap virtually disappeared (See Figure 7). e share of workers in IP-intensive industries
with a bachelor’s degree or higher fell to 39.8 percent in 2015, whereas that percentage increased
to 38.9 percent for workers in non-IP-intensive industries. Besides the increase in educational
attainment among workers in non-IP-intensive industries, trademark-intensive industries con-
tributed to the narrowing of the educational attainment gap. In 2015, the share of workers with
college education or higher in trademark-intensive industries fell to 36.6 percent (from 38.8
percent in 2010). By contrast, this share increased to 66.4 percent (from 61.2 percent in 2010) for
copyright-intensive industries and 41.7 percent (from 38.7 percent) for patent-intensive indus-
tries.
5.6
8.6
1.6
7.8
7.7
25.0
27.5
10.3
25.7
25.7
27.6
27.4
21.7
26.7
27.7
27.2
25.7
45.7
27.7
23.8
14.5
10.9
20.7
12.1
15.1
0%
20%
40%
60%
80%
100%
Patent-intensive Trademark -intensive Copyright-intensive IP-intensive Non-IP-intensive
Figure 7. Distribution of Employed Persons in IP-Intensive Industries
by Educational Attainment, 2015
Graduate
degree
Bachelor's
degree
Some college or
associate
degree
High school
diploma
Less than high
school
Source: Current Population Survey, 2015, Public Use Microdata Files and ESA calculations. Estimates are for employed persons age 25 and over.
35 These estimates are calculated from 2010 and 2015 Current Population Survey public-use microdata, as accessed
through the Census Bureau’s DataFerrett tool at dataferrett.census.gov.

InellecualProperandheUSconomUpdae
As was the case in 2010, workers in copyright-intensive industries were the most educated of the
three IP-intensive segments in 2015 with 20.7 percent having attained a graduate degree, and
only 1.6 percent having less than a high school diploma. e share of workers in patent-intensive
industries with at least a bachelor’s degree was smaller, at 41.7 percent, but still higher than the
share for non-IP-intensive industries. In trademark-intensive industries, however, the share of
workers with a college or higher degree fell below that of the non-IP-intensive industries by 2015.
alue added
While jobs in IP-intensive industries increased between 2010 and 2014, jobs in non-IP-intensive
industries grew at a slightly faster pace. Consequently, the proportion of total employment in
IP-intensive industries actually declined to 18.2 percent from18.8 percent in 2010. (See Figure
8) In contrast, the value added by IP-intensive industries increased substantially in total amount
and as a share of GDP between 2010 and 2014. IP-intensive industries accounted for $6.6 trillion
in value added in 2014, up more than $1.5 trillion (30 percent) from $5.06 trillion in 2010. Ac-
cordingly, the share of total U.S. GDP attributable to IP-intensive industries increased from 34.8
percent in 2010 to 38.2 percent in 2014.
Trademark- and copyright-intensive industries appear to be driving the recent growth in value
added. Between 2010 and 2014, the share of GDP attributed to trademark- and copyright-inten-
sive industries increased to 34.9 percent (from 30.8 percent) and 5.5 percent (from 4.4 percent),
respectively. Trademark-intensive industries alone accounted for $6.1 trillion in value added in
2014 (up from $4.5 trillion in 2010). e value added by patent-intensive industries increased
from $763 to $881 billion between 2010 and 2014. However, because this growth trailed the other
IP-intensive segments, the share of GDP attributable to patent-intensive industries declined from
5.3 percent to 5.1 by 2014.
InellecualProperandheUSconomUpdae
5.1%
34.9%
5.5%
38.2%
61.8%
2.6%
15.5%
3.7%
18.2%
81.8%
0%
15%
30%
45%
60%
75%
90%
Patent-intensive Trademark intensive Copyright intensive IP-intensive Non-IP-intensive
Figure 8. Value Added and Employment Shares of IP-Intensive Industries, 2014
Source: ESA calculations using data from the Bureau of Economic Analysis, National Income and Product Accounts and
the Bureau of Labor Statistics' Industry Productivity program.
Share of employment
Share of GDP
IP eenue
Up to this point, IP-intensity was dened based on the counts of patents, trademarks and copy-
rights per employee at the industry level. While this method adjusts total IP holdings for dier-
ences in industry size, it does not directly measure the revenue associated with using intellectual
property. Using revenue to dene IP-intensity is more restrictive because it requires rights hold-
ers to attribute some portion of total revenue directly to IP holdings, which is dicult due to the
intangible nature of IP assets. Ideally, information would be available on the full revenue stream
attributable to an industry’s intellectual property which would include both the measurable and
unmeasurable contributions of IP. With this information, an alternative IP-intensity metric could
be dened as total IP revenue or IP revenue as a share of total revenue, which is another way to
adjust for industry size.
Although comprehensive information of this type do not exist, the Economic Census of U.S.
business establishments does provide some data on measureable revenues associated with licens-
ing, royalties, and other forms of trade of intellectual property. e Economic Census, which is
conducted every ve years by the U.S. Census Bureau, asks companies to report sales by specic

InellecualProperandheUSconomUpdae
product lines.
36
Ninety-one of these product lines were identied as related to IP.
37
Revenue for
each of the 91 product lines were summed and used to dene an IP-intensity metric based on the
ratio of IP revenue to total revenue at the industry level.
Table 1 shows the 29 four-digit NAICS industries that had some IP-related revenue, ranked by
the IP share of total revenue in 2012. e distribution of IP-related revenue was fairly concen-
trated. Six industries had IP revenue shares above the 11.3 percent average (among industries
for which the Economic Census collected IP-related revenue), and these industries accounted for
about 82 percent of total revenue from IP-related products. All six industries were also identied
as IP-intensive using the IP counts per employee metric.
Overall, 15 of the 29 industries with any IP revenue in 2012 were also classied as IP-intensive
using the IP counts per employee metric. Of the 14 industries that were not previously classied,
ve were in the “other services (except public administration)” sector, four were in the arts, en-
tertainment, and recreation sector, four were in the professional, scientic and technical services
sector, and one was in the information sector.
36 TheEconomicCensusistheU.S.Government’sofcialve-yearmeasureofAmericanbusinessandtheeconomy.It
isconductedbytheU.S.CensusBureauandresponseisrequiredbylaw.Thelatestcensuswascompletedin2012.In
October through December 2012, forms were sent out to nearly 4 million businesses, including large, medium and
small companies representing all U.S. locations and industries. Respondents were asked to provide a range of oper-
ational and performance data for their companies. To learn more about the Economic Census, please see http://www.
census.gov/econ/census/.
TheindustryclassicationsforallestablishmentscoveredbytheeconomiccensusandsurveysarebasedontheNorth
AmericanIndustryClassicationSystem(NAICS).FormoreonIndustryClassicationofEstablishments:
http://www.census.gov/econ/census/help/naics_other_classication_systems/industry_classication_of_establishments.html.
37 Table A-11 in the appendix provides a complete list of these codes.

InellecualProperandheUSconomUpdae
able 1. Indusries ih IP-elaed eenue, aned b IP eenue Inensi, 01
NICS
code
IP-
inensie
Indusr ile
IP-relaed
reenue
$millions
Cumulaie
share
IP-reenue
inensi
IP/oal
reenue
Moionpicureandideo
indusries
essorsononnancialinangible
asses
Independenarissriersand
perormers
Soundrecordingindusries
Cableandohersubscripion
programming
Perormingarscompanies
gensandmanagersorpublic
gures
Oherinormaionserices
Promoersoperormingars
sporsandsimilareens
Specaorspors
adioandeleisionbroadcasing
Proessionalandsimilar
organiaions
Nespaperperiodicalbooand
direcorpublishers
Soarepublishers
Businessschoolsandcompuer
andmanagemenraining
Managemenocompaniesand
enerprises
egalserices
Socialadocacorganiaions
Compuerssemsdesignand
relaedserices
Oherproessionalscienicand
echnicalserices
Ciicandsocialorganiaions
Above mean + 1 std. dev.
Above mean

InellecualProperandheUSconomUpdae
derisingpublicrelaionsand
relaedserices
Museumshisoricalsiesand
similarinsiuions
rchiecuralengineeringand
relaedserices
ran-maingandgiingserices
Oherelecommunicaions
Oherpersonalserices
iredelecommunicaions
carriers
oal
ll indusries ih
IP-relaed reenue 1,684 100.0 11.
Note: Intensity measure is the percent of overall revenue generated for each four-digit NAICS industry from the licensing of
intellectual property protected assets.
Source: ESA calculations using data from the Census Bureau’s 2012 Economic Census.
e product line codes in the Economic Census can also be grouped into those that explicitly
mention IP licensing as the source of revenue. As shown in Table 2, revenue specic to the licens-
ing of IP rights totaled $115.2 billion in 2012, with 28 industries deriving revenues from licens-
ing. Among these industries, the motion picture and video industry generated the largest reve-
nue, $41.6 billion in 2012, followed by the cable and other subscription industry and the lessors
of nonnancial intangible assets industry. Not only do these three industries account for nearly
78 percent of all reported direct revenues from IP licensing, they also have the largest shares of
licensing revenue, averaging 50.7 percent of total revenue.
able . IP-licensing eenue b Indusr, 01
NICS code
and indusr ile
IP-licensing reenue
$millions
Share o oal reenue
oal
-Moionpicureandideoindusries
-Cableandohersubscripionprogramming
-essorsononnancialinangibleasses
-Oherinormaionserices
-Scienicresearchanddeelopmen
serices
-Soundrecordingindusries
-adioandeleisionbroadcasing
-Proessionalandsimilarorganiaions
-Soarepublishers
-Independenarissriersand
perormers

InellecualProperandheUSconomUpdae
-Nespaperperiodicalbooanddirecor
publishers
-Compuerssemsdesignandrelaed
serices
-Managemenocompaniesandenerprises
-Specaorspors
-gensandmanagersorpublicgures
-rchiecuralengineeringandrelaed
serices
-Perormingarscompanies
-Promoersoperormingarssporsand
similareens
-derisingpublicrelaionsandrelaed
serices
-Oherproessionalscienicandechnical
serices
-ran-maingandgiingserices
-Businessschoolsandcompuerand
managemenraining
-Socialadocacorganiaions
-Ciicandsocialorganiaions
-iredelecommunicaionscarriers
-Museumshisoricalsiesandsimilar
insiuions
-Oherelecommunicaions
-Oherpersonalserices
Source: U.S. Census Bureau, 2012 Economic Census
oreign rade
Once again using IP counts per employee to group industries, IP-intensive industries continue to
account for a signicant share of U.S. exports and imports. Total merchandise exports increased
from $775 to $842 billion between 2010 and 2014. However, because exports from non-IP-inten-
sive industries increased at a faster pace, the share of total merchandise exports from IP-intensive
industries declined to 52 percent in 2014 from 60 percent in 2010. e value of merchandise im-
ports into IP-intensive industries totaled $1,391 billion in 2014, which is largely unchanged from
2010, but fell as a percent of overall U.S. merchandise imports from 69.9 to 59.3 percent between
2010 and 2014.
e breakdown of exports by industry for 2014 is very similar to that for 2010. Manufacturing
industries accounted for 96 percent of merchandise exports from IP-intensive industries in 2014,
compared to 99 percent in 2010. Oil and gas extraction and nonmetallic minerals sectors account-
ed for the rest in both years. Within manufacturing, exports from the basic chemicals sector led
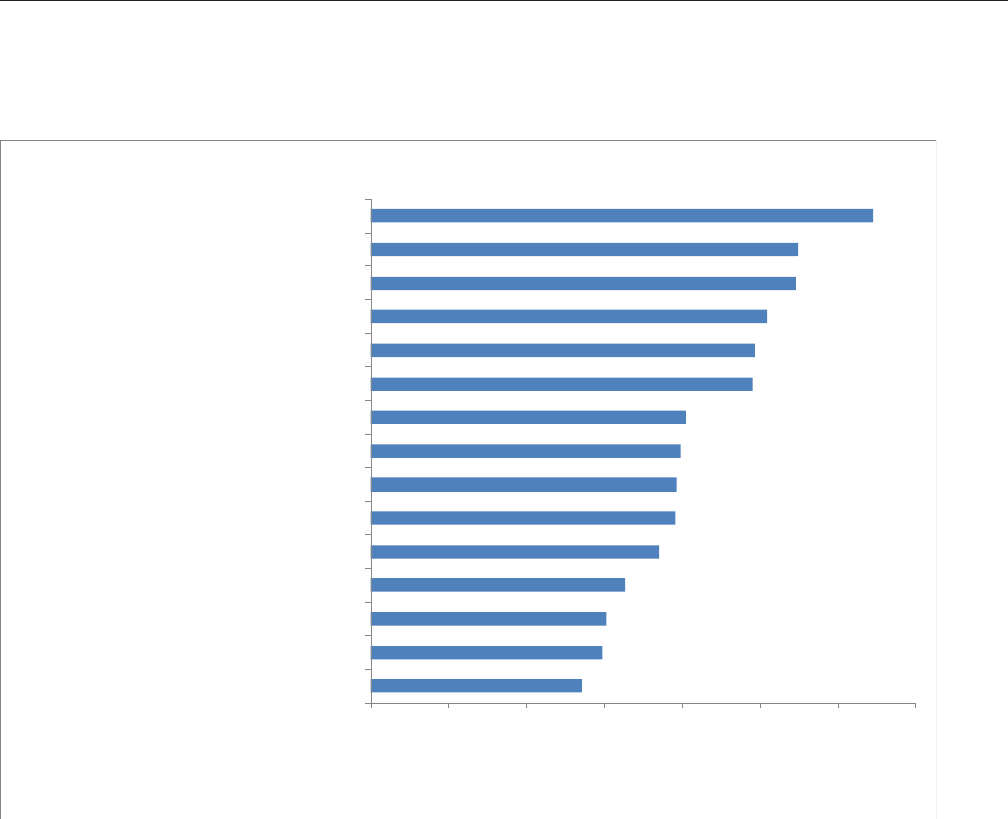
InellecualProperandheUSconomUpdae
the way, increasing from $58.4 to $64.5 billion between 2010 and 2014. Exports from the semi-
conductors and other electronic components sector, which topped the chart at $64.0 billion in 2010,
fell to $54.8 billion in 2014. (See Figure 9)
$27.1
$29.8
$30.3
$32.6
$37.0
$39.1
$39.2
$39.8
$40.5
$49.1
$49.3
$50.8
$54.5
$54.8
$64.5
$0 $10 $20 $30 $40 $50 $60 $70
Other Electrical Equip & Components
Oil & Gas
Engines, Turbines & Power Transmsn Equip
Medical Equip & Supplies
Nonferrous (exc Alum) & Processing
Ag & Construction & Machinery
Other General Purpose Machinery
Resin, Syn Rubber, Artf & Syn Fibers/fil
Communications Equipment
Computer Equipment
Misc Manufactured Commodities
Navigational/measuring/medical Instrument
Pharmaceuticals & Medicines
Semiconductors & Electronic Components
Basic Chemicals
Figure 9. Merchandise Exports of Selected IP-Intensive Industries, 2014
Billions of current dollars
Source: ESA
calculations
using data from the Census Bureau's Foreign Trade Division.
Note: The selected industries accounted for 76.5 percent of merchandise exports of IP-intensive industries.
Data on trade in services are more limited. However, using the latest Economic Census data, we
obtained detailed accounting of service exports for 2012. We nd that exports of service-provid-
ing IP-intensive industries totaled about $81 billion in 2012 (compared to $90 billion in 2007).
is accounted for 12.3 percent (compared to 19 percent in 2007) of total U.S. private exports in
services. As shown in Figure 10, exports of soware publishers totaled $22.7 billion and continue
to be the largest group of service exports. However, export by the portfolio management indus-
try, totaling $13.6 billion in 2012, replaced the motion picture and video industry for the second
place compared to the 2007 rankings. e latter went down from $15.3 billion in exports in 2007
to $7.3 billion in 2012 and appears to account for a substantial part of the decline in exports of
service-providing IP-intensive industries. Other major services export categories in 2012 includ-
ed computer system design ($7.8 billion), motion picture and video production ($7.3 billion),
management & technical consulting ($7.1 billion), and wired telecommunications carriers ($5.2
billion).

InellecualProperandheUSconomUpdae
$7.7
$1.4
$1.6
$2.9
$3.3
$5.2
$7.1
$7.3
$7.8
$13.6
$22.7
$0 $5 $10 $15 $20 $25
Other
Machinery and equip rental & leasing
Other telecommunications
Newspaper, book, & directory
Other information services
Wired telecommunications carriers
Manage't, scientific, & tech consult svcs
Motion picture and video production
Computer systems design & related svcs
Portfolio management
Software publishers
Figure 10. Exports of IP-Intensive Service-Providing Industries, 2012
Billions of current dollars
Source: ESA calculationsusing data from the Census Bureau's 2012 EconomicCensus.

InellecualProperandheUSconomUpdae
V. Conclusion
e 2012 report Intellectual Property and the U.S. Economy: Industries in Focus identied IP-in-
tensive industries and quantied their contribution to the U.S. economy. It found that in 2010
IP-intensive industries supported over 40 million jobs and accounted for about $5.06 trillion in
value added; equivalent to 34.8 percent of U.S. GDP. e current report provides updated results
demonstrating that IP-intensive industries supported 45.5 million jobs and contributed $6.6
trillion in value added in 2014, equivalent to 38.2 percent of U.S. GDP. In addition, the current
report reinforces the earlier nding that IP use permeates all aspects of the economy with in-
creasing intensity and extends to all parts of the U.S.
Besides data on the prevalence of IP, policy makers are interested in learning more about how
eectively it is used to stimulate economic activity. However, understanding the eectiveness and
benets of IP use requires an understanding of the value that IP owners attribute to their assets,
and how that value translates into incentives for the creation of new goods and services. While an
expansive welfare analysis of IP is beyond the scope of this report, evidence that informs such an
analysis is an important direction for future work.
With more granular data that connects inventors and rms of various types with IP assets, we
could start to answer a variety of questions about the distinct functions of IP in the economy. In
particular, policy makers would benet from research on whether IP users seek IP protection to
facilitate nancial investment in innovation, to support entrepreneurial liquidity, or to enable
technology transfer, and the extent to which these advantages stimulate inventive activity. Under-
standing the role of IP in the performance of diversely situated rms and in the economy overall
requires the application of a variety of methodologies and persistent eorts, many of which are
already underway.

InellecualProperandheUSconomUpdae
ppendi
In this Appendix, we provide a detailed discussion of the methodologies used to designate IP-in-
tensive industries for each of the three IP types (i.e. patents, trademarks, and copyrights). e
methodologies follow very closely what was applied in the 2012 report. We also provide a table of
the IP related product codes from the Economic Census which were discussed in the Section IV
under IP revenue.
Paens
Patents are classied in over 450 patent “technology classes” that distinguish their inventive
content.
38
Additionally, the USPTO maintains a general concordance between its technology
classications and 30 North America Industry Classication (NAICS) codes (26 unique codes
and 4 combinations), which enables analysts to associate patents with these industries.
39
We rely
on these NAICS-based patent counts for 2009 to 2013 to identify patent-intensive industries.
40
Just as a patent can be assigned to more than one technology class, it also may be associated with
multiple industries. Because no similar concordances to NAICS are available for plant or design
patents, only utility patents are used in our analysis.
41
is approach strictly limits the patent
analysis to the manufacturing sector because the concordance system only associates patents
with manufacturing industries. Service-providing industries may also rely on utility patents in
their production processes, but these industries are not captured by the patent-NAICS concor-
dance we employ.
racional s. hole Paens Couns
e USPTO reports patent data by NAICS category using two dierent counting measures. e
rst gives one full count to every industry with which a particular patent is associated. e sec-
ond divides each patent by the number of industries it is associated with, thus creating fractional
counts of patents. e sum of the fractional counts equals the total number of patents issued
in a given year, while the sum of the whole counts across industries is greater than the number
of patents issued. Patent analyses within a given industry or technology class commonly use
whole counts; however, cross-industry analyses typically use fractional counts in order to avoid
over-counting. For these same reasons, fractional counts are used in this report.
42
It is important
to note that the NAICS concordance maintained by the USPTO associated each patent with its
38 Utilitypatentsmaybeclassiedintomorethanonetechnologyclassbutareorganizedaccordingtotheirprimaryclas-
sication.
39 ThisconcordancewascreatedbytheUSPTOwithnancialsupportfromtheNationalScienceFoundation.Foran
overview of NAICS, see www.census.gov/eos/www/naics/index.html.
40 Seewww.uspto.gov/web/ofces/ac/ido/oeip/taf/data/misc/patenting_trends/info_ptrends2008.txt.
41 To contrast the scale of technology patents, design patents break out into 33 classes and plants have only one patent
class.Seewww.uspto.gov/web/ofces/ac/ido/oeip/taf/all_tech.htmformoreinformationonutilitypatents.
42 It should be noted that the use of fractional patent counts differs from our treatment of trademarks registrations for
which only whole counts of registrations by class are available.

InellecualProperandheUSconomUpdae
nal use in the economy. In practice, this means that the patents are all associated with manufac-
turing NAICS codes regardless of whether the company that owns them is a manufacturer or a
company that may be classied in the services sector.
43
Mehodolog
Using the USPTO maintained concordance, we calculate a measure of industry patent “intensity,”
dened as the ratio of total patents over the ve years (2009–2013) in a NAICS category to the
average payroll employment by industry. Because employment is a gauge of industry size, divid-
ing patent counts by employment normalizes patenting activity with respect to industry size.
44
is approach helps put all industries on an even playing eld, so that the most patent-intensive
industries are dened not as the ones with the most patents, but rather those with the most pat-
ents per worker.
By using a ve-year period (in this case, years 2009–13) instead of just one year helps minimize
the chance that anomalies in any given year will skew our results. e analysis was performed
at the highest possible level of NAICS industry detail, and so results include four-digit indus-
tries as well as some individual three-digit industries and combinations of three- or four-digit
industries.
45
As shown in Table A-1, most patent-intensive industries in the sample fall into the
four-digit NAICS industries, which may be a product of the patent-intensive nature of these
more nely disaggregated industry sectors.
43 Forfulldetailsonthenatureandcaveatsofthepatentdataused,seewww.uspto.gov/web/ofces/ac/ido/oeip/taf/govt/
naics/explan_naics.htm.
44 Value added and gross output are two alternative gauges of industry size. However, estimates at the level of detail
neededforthisanalysisarenotavailableduetodatacondentialitylimitations.
45 IntheNAICSclassication,athree-digitcodeisalargeraggregationascomparedtoafour-digitcode.So,forinstance,
NAICS 236 “construction of buildings” is a larger aggregation of which NAICS 2361 “residential building construc-
tion”isasmallerandmorespecicsubset.

InellecualProperandheUSconomUpdae
able -1. Paen Inensi, 009–1
NICS code Indusr ile
Paens
number
mplomen
1000 jobs
Paen
Inensi
paens/1000
jobs
Compuerandperipheralequipmen
Communicaionsequipmen
-
Ohercompuerandelecronic
producs
Naigaionalmeasuring
elecromedicalandconrol
Insrumens
Semiconducorsandoher
elecroniccomponens
Basicchemicals
Ohermiscellaneous
lecricalequipmenappliances
andcomponens
Medicalequipmenandsupplies
Pharmaceuicalandmedicines
---
Oherchemicalproducand
preparaion
Machiner Above Mean
esinsnheicrubberandaricial
andsnheicbersandlamens
Plasicsandrubberproducs
abricaedmealproducs
-- Oherransporaionequipmen
-- Moorehiclesrailersandpars
Nonmeallicmineralproducs
--- eilesapparelandleaher
erospaceproducandpars
urniureandrelaedproducs
Primarmeal
oodproducs
-
Paperpriningandsuppor
aciiies
Beerageandobaccoproducs
ood
oal 488 10.0 46.0
Source: USPTO calculations using the agency’s patent data and the Bureau of Labor Statistics’ Industry Productivity program.
Note: Patent intensity is dened as the ratio of patents to employment and is measured in patents/thousand jobs.

InellecualProperandheUSconomUpdae
rademars
Unlike patents, there is little academic research examining industry use of trademarks. e 2012
report oered what may be the rst comprehensive analysis of trademark use by U.S. industries
that is grounded in original research, data, and measurement theory. e methodology applied
in the current report and detailed below is derived from what was designed in the 2012 report.
As a preliminary matter, we recognized that each trademark registration has a description of the
type of good or service with which the protected mark is used in commerce. e USPTO classi-
es goods and services for administrative convenience, and applicants for trademark registration
must provide a separate description — and pay separate application and maintenance fees — for
each “class” in which the goods or services associated with the trademark is classied.
46
is
makes working with trademark registration data dierent from working with patent grant data.
Trademark application and maintenance fees are assessed on a per-class basis, and registration
holders may elect to renew their registrations with respect to some but not all classes.
47
As a
result, holding a “multi-class” registration is practically equivalent to holding multiple registra-
tions, one for each class. Accordingly, in the foregoing analysis each class listed on a registration
was considered as the unit of analysis, creating a class-registration count. For example, if one
mark (or logo) is registered in three classes,
48
then our input measure in the analysis reects three
trademark registration counts, one for each class.
e approach that we adopted for measuring trademark-intensive industries parallels, but diers
from, the approach employed when analyzing patents. For patents, each patent was counted only
once overall; for trademark measurements, each mark is counted once for each class in which
it belongs, potentially counting it more than once overall according to the number of classes in
which it is registered. Since it is not easy to ascertain which trademarks are relatively more im-
portant, we use the best measure available, based on the economic realities of the fee system.
49
Because each trademark registration-class involves some xed ling fee paid to the USPTO, the
more classes in which a trademark is registered indicate more times that a fee has been paid to
the USPTO. Using these fee-payments is an eective method to base an IP-intensity measure and
this approach was followed consistently for both trademarks and patents.
46 For a list of classes, see Trademark Manual of Examining Procedure (TMEP) chapter 1400 (April 2016 edition). Fees
also are a function of the type of application form used. For more information on the trademarking process, see Trade-
mark Basicsatwww.uspto.gov/trademarks/basics/BasicFacts_with_correct_links.pdf.
47 Each class used to group the goods or services in a registration for purposes of administrative fee payments may cover
a wide variety of goods or services. A trademark right exists as to each good or service on or in connection with which
themarkisused.Theclassicationofthegoodsandservicesdoesnotdeterminethescopeoftheprotectiongiventoa
mark.
48 Anexampleisthemark“Nike”beingregisteredinclassesassociatedwith(a)software,(b)golfequipment,and(c)
eyewear. See U.S. trademark registration numbers 3406594, 3389746, and 3081688, each by Nike, Inc.
49 Wecouldweightcompaniesbynumberofemployees,butitismoredifculttodecidewhetheragiventrademark
taken by itself should be weighted heavily or lightly.

InellecualProperandheUSconomUpdae
Because trademark registrations can be segmented by class but not by industry, there is no
USPTO NAICS concordance for these data. Due to this methodological limitation, there is no
single, straightforward way to tabulate registrations and measure trademark intensity by indus-
try. Accordingly, and because the measurement of trademark use is a new science, we opted for
over-inclusiveness and developed a three-pronged approach to identifying trademark-intensive
industries.
We relied on three related but distinct approaches, using dierent samples of companies that have
registered USPTO trademarks. e rst approach is the closest approximation to the methodolo-
gy used to identify patent-intensive industries. Starting with the complete set of trademark regis-
trations, we matched publicly traded companies by their name to a separate database containing
information on the rms’ primary industry and number of employees. ese data allowed us
to calculate trademark intensity by industry for the matched rms. In the second approach, we
reviewed lists of the top 50 corporate trademark registrants published by the USPTO (which, un-
like the rst approach, include both private and public companies) and identied industries that
appear repeatedly. To help moderate the tendency of the rst two approaches to under-represent
smaller and younger rms, our third approach took a representative and random sample of rms
drawn from the complete database of U.S. corporate trademark registrations from 2009 to 2013.
rademar Inensi
Mehodolog 1
Like our method for dening patent intensity, we dene trademark intensity as the ratio of trade-
mark registrations to employment in a given industry. us, we are measuring the number of
trademark registrations per employee. e USPTO applied a rm-name standardization rou-
tine developed originally for patent analysis in order to match companies with new trademark
registrations to companies in Compustat’s database of nancial statements of publicly traded
companies.
50
is matching identied 507,008 distinct standardized rm names in the 2009–13
trademark registration and trademark renewal records. ese were rms that either registered
or renewed at least one trademark from 2009 to 2013. We merged these records with 9531 stan-
dardized parent-company records drawn from the Compustat database. Successful matches were
made for 3094 rms. Since Compustat records also include NAICS codes, we were able to sum
trademark registrations and employment by four-digit NAICS industry and then estimate indus-
try trademark intensity as the number of matched rm trademarks per worker in each industry.
51
Because Compustat does not record the relationships between parent and subsidiary companies,
the identities of trademark registrants were only matched to the name of the publicly traded
50 This methodology has previously been applied in studies of patents, particularly as detailed in Hall, Jaffe, and Trajten-
berg 2001. This paper and other supporting documentation are available at www.nber.org/patents/.
51 TotheextentthatmatchedrmsdifferintheirFederaltrademarkregistrationbehaviorrelativetounmatchedrms,
these trademark intensities are biased. However, what really matters for our analysis is not whether the estimates are
individually biased but rather if any bias varies across industries.

InellecualProperandheUSconomUpdae
parent company reporting nancial statements to the U.S. government. Accordingly, trademarks
registered in the name of subsidiaries that have dierent names than the parent company were
not matched by our method.
52
Table A-3 provides the designation of trademark-intensive industries for years 2009–2013 us-
ing the rst of the three methodologies. While there are notable dierences, there is signicant
overlap between the industries in this list compared to the one in the 2012 report covering
years 2004–2008. ere are two main sources of dierences. First, while the methodology is the
same in both cases, a more exhaustive data cleaning process in the current report led to a more
comprehensive coverage of rms with trademark registration that were assigned to an industry.
Secondly, an industry is added to the data as trademark-intensive only if there are at least ve
rms identied that belong to it. us, a single additional rm can determine whether an indus-
try is designated as trademark-intensive. Although unlikely, this could signicantly impact the
rank-order of some industries. For example, while land subdivision (NAICS 2372) did not make
it in the list of trademark-intensive industries in the previous report, it is on the top of the cur-
rent list as presented in Table A-3 below. Despite these dierences, we again nd signicant con-
sistency across the two periods as over 65 percent of the industries designated as trademark-in-
tensive in the 2012 report are also included in the current list.
able -. Indusries ih boe-erage rademar Inensi, 009–1
Naics
Code Indusr ile
rademar
Inensi
rademars/1000
orers
Naics
Code Indusr ile
rademar
Inensi
rademars/1000
orers
andsubdiision
Householdand
insiuionalurniure
andichencabines
Oherinesmen
poolsandunds
Oupaiencare
ceners
Ohermiscellaneous
manuacuring
Commercial
equipmen
udioandideo
equipmen
manuacuring
ooear
manuacuring
lecriclighing
equipmen
Nonmeallicmineral
miningandquarring
Oheroodproducs essorsorealesae
Oherinormaion
serices Oilandgaseracion
52 For this reason, this method not only tends to overweight large, publicly traded companies, but also those companies
that have a particular trademark-registration approach. Which is consistent with patent scholarship suggesting that IP
ownershipmayshowsystematicdifferencesalongthesedimensions.SeeAroraetal.2011,29–30.

InellecualProperandheUSconomUpdae
lecronicshopping
andmail-order
houses Basicchemicals
Securiiesand
commodi
echanges
Priningandrelaed
supporaciiies
Nespaper
periodicalbooand
direcorpublishers
Managemenand
echnicalconsuling
serices
Oherambulaor
healhcareserices
Nonerrousmeal
ecepaluminum
producionand
processing
Ohernonmeallic
mineralproducs Dairproducs
essorso
nonnancial
inangibleasses
ecepcoprighed
ors Insurancecarriers
ciiiesrelaedo
crediinermediaion
ired
elecommunicaions
carriers
Soarepublishers
Nauralgas
disribuion
Indusrialmachiner
Ohersuppor
serices
amblingindusries
lecricaland
elecronicgoods
adioandeleision
broadcasing
Commercialand
sericeindusr
machiner
Medicalequipmen
andsupplies
lecronic
insrumens
Oherelecrical
equipmenand
componens
esinsnheic
rubberandaricial
snheicbersand
lamens
Pharmaceuicalsand
medicine Plasicsproducs
Soapscleaning
compoundsand
oilepreparaions
ruiandegeable
preseringand
specialood

InellecualProperandheUSconomUpdae
reighransporaion
arrangemen
Oherproessional
andechnical
serices
Pesicideseriliers
andoheragriculural
chemicals
esidenialbuilding
consrucion
derisingand
relaedserices
Ohergeneral
purposemachiner
rocerandrelaed
producs
Moionpicureand
ideoindusries
Oherransporaion
equipmen
Cableandoher
subscripion
programming
Oher
elecommunicaions
Medicaland
diagnosic
laboraories
Ohernancial
inesmenaciiies Beerages
Machinerand
equipmenrenaland
leasing
ngineurbineand
poerransmission
equipmen
Communicaions
equipmen
Poergeneraionand
suppl
Source: USPTO calculations using the agency’s trademark registration data and company employment data from Compustat.
op 0 rademar egisering Companies
Mehodolog
Since 2006, the USPTO’s annual Fiscal Year Performance and Accountability Reports have iden-
tied the 50 companies that obtained the largest number of trademark registrations during the
Federal scal year (FY) pertaining to that report.
53
Because these reports do not provide the pri-
mary NAICS code of the companies in question, we used Avention and Manta to determine the
relevant NAICS industry classication for each of the companies listed for FY 2009–13.
54
On the
theory that these large companies operate in industries with large numbers of trademark registra-
tions relative to the size of the industry, those industries were dened as trademark-intensive.
53 See www.uspto.gov/about/stratplan/ar/index.jsp to access the annual “Performance and Accountability Reports.” In
each report, the Top 50 Trademark Registrants tables are Table 29B or 30B within the USPTO Workload Tables in
Section 5, “Other Accompanying Information.” The most recent list of Top 50 trademark registrants is for FY2015.
54 WeusedbothAventionandMantaNAICSclassicationofindividualrms.IfonlyoneofthesesourcesprovideaNA-
ICScodefortherm,werecordthatNAICSastheappropriateclassication.Ifthereisamismatchbetweenthetwo
sources,weresearchedtherm’slineofbusinessusingInternetsearchesandidentiedwhichofthetwogaveamore
appropriateclassication.Ifneitherhaveappropriateclassication,thermisnotincludedinthesample.

InellecualProperandheUSconomUpdae
Aer assigning each company to a four-digit NAICS industry, we tabulated the number of times
companies within each industry appeared in the top 50 during the FY 2009–13 period. We des-
ignated industries with counts of ve or larger as trademark-intensive. At the extremes, counts
of ve or higher occurred if a given company was among the top 50 registrants in each of the ve
years studied, or if ve dierent companies in an industry had reached the top 50 in a single year
during the period.
e results are provided in Table A-4. Only three industries are missing from the list of trade-
mark-intensive industries listed in Table A-3. ese are grocery stores (NAICS 4451), sugar con-
fectionery product manufacturing (NAICS 3113), and department Stores (NAICS 4521).
able -4. Indusries ih ie or More ppearances in he isings o
op 0 rademar egisering Companies, 009–1
NICS
Code Indusr ile
Number o op 0
ppearances
Ohermiscellaneousmanuacuring
Pharmaceuicalandmedicinemanuacuring
Soapcleaningcompoundandoilepreparaionmanuacuring
Moionpicureandideoindusries
adioandeleisionbroadcasing
udioandideoequipmenmanuacuring
amblingindusries
rocersores
Insurancecarriers
Sugarandconecionerproducmanuacuring
Deparmensores
Source: USPTO calculations using data from the USPTO’s Annual Performance and Accountability Report, Avention, Manta,
and Internet searches.
andom Sample o ll rademar egisraions
Mehodolog
One shortcoming of identifying industries based on the trademark intensity or top 50 appear-
ances is that these approaches tend to bias selection toward larger companies that register a
greater number of trademarks.
55
Moreover, these approaches can fail to account for the critical
importance that single trademarks may hold for large entities (for instance, Coca-Cola so drink
or Apple personal computer) or of dierences in industry composition and concentration. Ac-
cordingly, those methods will miss industries composed of smaller companies that may account
for many trademarks as a group but do not otherwise fall in the USPTO top 50 listing. To help
55 Note that many small companies use trademarks but, for various reasons, do not seek Federal registration. Yet they still
have rights in those marks under common law.

InellecualProperandheUSconomUpdae
overcome this shortcoming, we supplemented our analyses with a random sample of registrants
drawn from the universe of all 194,326 trademarks registered in 2013. ese data were generated
by the USPTO using publicly available source data.
56
To measure the industry share of total regis-
tered trademarks, a random sample of 300 registrations was drawn from this dataset. U.S. com-
panies were listed as the registrant on 247 of these 300 trademark registrations.
57
We assigned
four-digit NAICS industry codes to these U.S. rms using the same procedure employed for the
top 50 corporate registrants.
58
Table A-5 lists those industries that were two standard deviations
above the mean in the number of companies that were associated with them. e only addition-
al industry that was identied as trademark-intensive using this methodology is civic and social
organizations (NAICS 8134).
able -. Percen Disribuion o rademar egisraions o Seleced Indusries rom
Sample o U.S.-Oned, rademar-egisran Companies, aned b Percen, 01
NICS code Indusr ile Percen
Ohermiscellaneousmanuacuring
derisingandrelaedserices
Nespaperperiodicalbooanddirecorpublishers
Ciicandsocialorganiaions
Medicalequipmenandsupplies
Commercialequipmen
Source: USPTO calculations using the agency’s trademark registration data.
One limitation of this approach is that the sample was drawn from records that pertain to only a
single year. is may result in the under-identication of industries that generally register fre-
quently in an average year, but, for some reason, were less active in 2013 (which may not be a
representative year). e sample size is another important limitation. e sample we used was
small because assigning NAICS codes to each company requires the use of many resources. In an
ideal data world, the USPTO trademark registry would include each corporate registrant’s NA-
ICS code; however, such information is not provided in trademark applications and therefore is
not included in the USPTO database. e process of assigning NAICS codes to companies was
especially cumbersome because many of the rms drawn from the sample were small businesses
56 See USPTO’s electronic bulk data products available at https://www.uspto.gov/learning-and-resources/electron-
ic-bulk-data-products. For bulk research datasets, see http://www.uspto.gov/learning-and-resources/electronic-da-
ta-products/data.
57 ThisanalysiswasrestrictedtoU.S.-ownedrmsbecauseofthegreatdifcultyinassigningNAICScodesforsmall,
foreign-ownedrms.
58 Because the sample was drawn by registrations as opposed to registrants, a single individual or company could be
drawn more than once. However, based on the review of the registrant names, it does not appear to be the case that we
have multiple draws of the same entity in our sample.

InellecualProperandheUSconomUpdae
with few employees and had little publicly available information from which to nd or infer a
NAICS classication.
Table A-6 provides a complete list of all 68 industries designated as trademark-intensive and
better illustrates their signicant overlap as identied by the three methodologies. All but four of
the industries listed in Table A-6 were selected based on their above-average trademark intensity.
ese four additional industries were selected based on either their top 50 registrations or the
trademark registration sample; but none of these industries was agged by both methods. Only
one industry, other miscellaneous manufacturing (NAICS 3399), was selected through all three
methods.
able -6. rademar-Inensie Indusries and Selecion Crieria
NICS
Code
Indusr ile
Selecion Crierion
rademar
Inensi op 0 Sample
Oilandgaseracion
Nonmeallicmineralminingandquarring
Poergeneraionandsuppl
Nauralgasdisribuion
esidenialbuildingconsrucion
andsubdiision
SugarandConecionarProducManuacuring
ruiandegeablepreseringandspecialood
Dairproducs
Beerages
ooearmanuacuring
Oheroodproducs
Priningandrelaedsupporaciiies
Basicchemicals
esinsnheicrubberandaricialsnheicbersand
lamens
Pesicideseriliersandoheragriculuralchemicals
Pharmaceuicalsandmedicine
Soapscleaningcompoundsandoilepreparaions
Plasicsproducs
Ohernonmeallicmineralproducs
Nonerrousmealecepaluminumproducionand
processing
Indusrialmachiner
Commercialandsericeindusrmachiner

InellecualProperandheUSconomUpdae
ngineurbineandpoerransmissionequipmen
Ohergeneralpurposemachiner
Communicaionsequipmen
udioandideoequipmenmanuacuring
lecronicinsrumens
lecriclighingequipmen
Oherelecricalequipmenandcomponens
Oherransporaionequipmen
Householdandinsiuionalurniureandichencabines
Medicalequipmenandsupplies
Ohermiscellaneousmanuacuring
Commercialequipmen
lecricalandelecronicgoods
rocerandrelaedproducs
rocerSores
DeparmenSores
lecronicshoppingandmail-orderhouses
reighransporaionarrangemen
Nespaperperiodicalbooanddirecorpublishers
Soarepublishers
Moionpicureandideoindusries
adioandeleisionbroadcasing
Cableandohersubscripionprogramming
iredelecommunicaionscarriers
Oherelecommunicaions
Oherinormaionserices
ciiiesrelaedocrediinermediaion
Securiiesandcommodiechanges
Ohernancialinesmenaciiies
Insurancecarriers
Oherinesmenpoolsandunds
essorsorealesae
Machinerandequipmenrenalandleasing
essorsononnancialinangibleassesecep
coprighedors
Managemenandechnicalconsulingserices
derisingandrelaedserices
Oherproessionalandechnicalserices

InellecualProperandheUSconomUpdae
Ohersupporserices
Oupaiencareceners
Medicalanddiagnosiclaboraories
Oherambulaorhealhcareserices
amblingindusries
CiicandSocialOrganiaions
Source: USPTO calculations.
As an additional way of checking the robustness of our methodologies, we use the listing of the
top hundred global brands in 2013 as identied by Interbrand’s report of Best Global Brands.
We nd that 52 out of the 100 top global brands have a NAICS code that corresponds to that of
25 out of the 68 industries that we designated as trademark-intensive. While we were still able
to capture more than half of these brands, it is a signicantly lower rate than the 70 percent
achieved in the 2012 report.
able -. rademar-Inensie Indusries ih op 100 lobal Brands in 01
Naics
Code
Indusr ile Brand
Oilandgaseracion Shell
Dairproducs DanoneNesle
Beerages
Coca-ColaPepsiBudeiser
NescaeSprieCoronaHeineen
JacDanielsJohnniealer
SmirnoMoeChandron
ooearmanuacuring Niedidas
Pharmaceuicalsandmedicine JohnsonandJohnson
Soapscleaningcompoundsandoilepreparaions illee’OrealColgaeon
Ohernonmeallicmineralproducs M
ngineurbineandpoerransmissionequipmen enerallecric
Communicaionsequipmen CiscoNoia
udioandideoequipmenmanuacuring SamsungPhillipsSonPanasonic
lecronicinsrumens Siemens
Oherelecricalequipmenandcomponens Duracell
Oherransporaionequipmen HarleDaidson
Ohermiscellaneousmanuacuring CarierNinendo
lecronicshoppingandmail-orderhouses maoncomba
Nespaperperiodicalbooanddirecorpublishers homsoneuers
Soarepublishers MicrosoOracleSPdobe
Moionpicureandideoindusries Discoer
adioandeleisionbroadcasing DisneM
Oherelecommunicaions aceboo

InellecualProperandheUSconomUpdae
Oherinormaionserices oogle
ciiiesrelaedocrediinermediaion isaMasercard
Ohernancialinesmenaciiies Cii
Insurancecarriers llian
Managemenandechnicalconsulingserices ccenure
Source: USPTO calculations using Interbrand’s Top 100 Global Brands and data from Avention and Manta.
As noted before, the trademark registrations are organized by class in the USPTO database. As
reected in their class title, these 49 trademark classes are divided by the function or purpose of
the good or branches of activities for services associated with a particular trademark. is diers
signicantly from the NAICS industry classication which aims to indicate the principal busi-
ness activity of an establishment. However, looking at the trademark registration rate by class can
give some insight about the products through which trademarks impact the economy the most.
Table A-8 provides a ranked list of total trademark registrations for years 2004 – 2013. e or-
der is very closely related to what was observed in the 2012 report. Furthermore, as in the 2012
report, the same top seven trademark classes accounted for more than half of all registrations in
this time period. ree of these classes are very broad and cover services ranging from wholesale
and retail trade to professional and business services, nancial services, insurance, education-
al services and the arts, entertainment, and recreation industry that consumers use on a daily
basis.
59
We also observe that many of the industries we designated as trademark-intensive cor-
respond to the top seven classes, and all of those designated as trademark-intensive using more
than one methodology seem to t into one of the top seven classes.
able -8. rademar egisraions b Class, aned b
Number o egisraions, 004–01
rademar egisraions
rademar
Class
Class ile oal Percen o
oal
Cumulaie
Percen
lecricalandscienicapparaus
derisingandbusiness
ducaionandenerainmen
Compuerandscienic
Clohing
Insuranceandnancial
Papergoodsandprinedmaer
Pharmaceuicals
Cosmeicsandcleaningpreparaions
osandsporinggoods
59 These classes are advertising and business (class 35), education and entertainment (class 41), and insurance and nan-
cial (class 36).

InellecualProperandheUSconomUpdae
Sapleoods
Medicalbeauandagriculural
Buildingconsrucionandrepair
Hoelsandresaurans
Machiner
nironmenalconrolapparaus
Medicalapparaus
elecommunicaions
Personalandlegal
urniureandariclesnooheriseclassied
Measandprocessedoods
Housearesandglass
Chemicals
inesandspiris
ehicles
ransporaionandsorage
eahergoods
Jeelr
Mealgoods
reamenomaerials
ighbeerages
Non-meallicbuildingmaerials
Nauralagriculuralproducs
abrics
ubbergoods
Handools
Pains
ubricansanduels
Smoers’aricles
ancgoods
loorcoerings
Cordageandbers
irearms
Musicalinsrumens
B Sericescericaionmar
arnsandhreads
Colleciemembership
oodscericaionmar
oal 1896 100.00 100
Source: USPTO calculations using the agency’s trademark registration data.
Note: e cumulative percent gures may not equal the sum of the percent of total gures because of rounding.

InellecualProperandheUSconomUpdae
Coprighs
As indicated in the text, our methodology for designating copyright-intensive industries draws
heavily from denitions established by the World Intellectual Property Organization’s (WIPO)
Guide on Surveying the Economic Contribution of the Copyright-based Industries.
60
A series of
reports by Stephen Siwek titled Copyright Industries in the U.S. Economy have applied these
denitions to the U.S. economy.
61
While this established literature underlies our analysis, we used
a more narrow denition of copyright-intensive industries than WIPO, focusing on industries
that produce copyrighted work and excluding several industries associated with the distribution
of copyrighted material. is deviation from the WIPO Guide was needed in order to maintain
internal consistency with our measures of patent- and trademark-intensive industries.
Mehodolog
Because WIPO’s Guide on Surveying the Economic Contribution of the Copyright-based Industries
clearly distinguishes the type of works that can be copyrighted, the industries in which those
works are created, and the downstream (distribution) industries delivering the produced copy-
righted works, it is possible to develop a list of copyright-intensive industries that is comparable
in scope to our lists of patent- and trademark-intensive industries. We started by focusing on
“core” copyright industries, which WIPO denes as industries “wholly engaged in creation, pro-
duction and manufacturing, performance, broadcast, communication and exhibition, or distri-
bution and sales of works and other protected subject matter.”
62
In other words, core copyright
industries were considered ‘core’ because they either produce copyrighted materials or bring
them to market.
For this report, we are only concerned with the set of industries that are primarily responsible
for the creation or production of copyrighted materials and designate them as copyright-inten-
sive. us, to the extent possible using four-digit NAICS industry codes, we excluded industries
whose primary purpose is to distribute copyright materials to businesses, consumers or both. For
example, we did not count industries such as book, periodical, and music stores (NAICS 4512) or
consumer goods rental (NAICS 5322), which includes video rentals, as copyright-intensive even
though they are part of the “core” category in the WIPO guide.
63
Our denition is narrower than
WIPO’s in order to be consistent with our treatment of patent- and trademark-intensive indus-
tries, where industries most responsible for the production of protected IP are the main focus.
is approach simply reects our goal of examining the industries in the economy that are most
60 World Intellectual Property Organization 2003.
61 See, for example, Siwek 2009.
62 World Intellectual Property Organization 2003, 29. The core copyright industries represent one of four main groups of
copyright-based industries. The others are interdependent, partial, and non-dedicated support industries.
63 ThisdiscussionshouldnotimplythatdistributionindustriesasawholecannotbyourdenitionsbeconsideredIP-in-
tensive. As discussed above, a broad range of industries seek trademark protection, including distribution industries
likeclothingstores,whichareidentiedasIP-intensive.

InellecualProperandheUSconomUpdae
responsible for the production of protected IP and use of this approach is not a criticism of WI-
PO’s guidelines.
One conceptual distinction between the approach taken here and that selected in the patent and
trademark sections is worth noting. roughout this report, the focus was on industries that
produce protected IP, whether patents, trademarks, or copyrights. In the case of patents and
trademarks, we dened “intensive” industries as the subset of all patent or trademark producers
that had high scores in various “intensity” measures, whereas we dene as copyright-intensive
essentially all industries traditionally associated with the production of copyrighted materials.
Table A-9 lists the copyright-intensive industries. All are involved in the creation and/or record-
ing (in print, magnetically, or digitally) of protected works.
64
able -9. Coprigh-Inensie Indusries
NICS code Indusr ile
Nespaperperiodicalbooanddirecorpublishers
Soarepublishers
Moionpicureandideoindusries
SoundecordingIndusries
adioandeleisionbroadcasing
Cableandohersubscripionprogramming
Oherinormaionsericesnessndicaesandinernesies
Specialieddesignsericesisualandgraphicars
Compuerssemsdesignandrelaedsericessoareanddaabases
derisingandrelaedserices
Oherproessionalandechnicalserices
Perormingarscompanies
Independenarissriersandperormers
Source: ESA selection based on World Intellectual Property Organization 2003.
Combined is o IP-inensie indusries
Table A-10 provides the total list of all eighty-one unique IP-intensive industries that we obtain
from a combination of the patent-, trademark-, and copyright-intensive industries we already
identied. In light of the considerable overlap between the patent- and trademark-intensive
industries and some between copyright- and trademark-intensive industries, the 81-industry
total is smaller than the sum of the parts. is table also indicates that 15 out of the 25 patent-in-
tensive industries are designated as both patent- and trademark-intensive while 7 out of the 13
copyright-intensive industries are designated as both trademark- and copyright-intensive. By
construction, there does not exist any overlap between patent- and copyright-intensive industries.
64 We list the relevant copyrighted materials in parentheses if the title describing the industry does not clearly indicate
what protected materials are produced (e.g. other information services (NAICS 5191)).

InellecualProperandheUSconomUpdae
is is because the USPTO developed a concordance of patent technology only to manufacturing
industries from which the patent-intensive industries are identied. ese industries do not cov-
er any of the service sectors from which the copyright-intensive industries are drawn.
Table A-10 also provides the employment count in 2013 for each of these IP-intensive industries,
totaling 27.3 million jobs for the year.
65
able -10. IP-Inensie and Selecion Crieria
NICS
Code
Indusr ile Selecion crieria
mplomen
in 01
1000 jobs
Paen-
Inensie
rademar-
Inensie
Coprigh-
Inensie
Oilandgaseracion
Nonmeallicmineralminingandquarring
Poergeneraionandsuppl
Nauralgasdisribuion
esidenialbuildingconsrucion
andsubdiision
Sugarandconecionarproduc
manuacuring
ruiandegeablepreseringand
specialood
Dairproducs
Beerages
ooearmanuacuring
Oheroodproducs
Priningandrelaedsupporaciiies
Basicchemicals
esinsnheicrubberandaricial
snheicbersandlamens
Pesicideseriliersandoher
agriculuralchemicals
Pharmaceuicalsandmedicine
Paincoaingandadhesie
manuacuring
Soapscleaningcompoundsandoile
preparaions
Oherchemicalproducandpreparaion
manuacuring
Plasicsproducs
65 In addition to wage and salary jobs, the employment count included self-employment; which accounts for a sizeable
portion of employment in the copyright-intensive industries.

InellecualProperandheUSconomUpdae
Ohernonmeallicmineralproducs
Nonerrousmealecepaluminum
producionandprocessing
griculureconsrucionandmining
machinermanuacuring
Indusrialmachiner
Commercialandsericeindusr
machiner
enilaionheaingair-condiioning
andcommercialrerigeraionequipmen
manuacuring
Mealoringmachinermanuacuring
ngineurbineandpoerransmission
equipmen
Ohergeneralpurposemachiner
Compuerandperipheralequipmen
Communicaionsequipmen
udioandideoequipmenmanuacuring
Semiconducorsandoherelecronic
componens
lecronicinsrumens
Manuacuringandreproducingmagneic
andopicalmedia
lecriclighingequipmen
Householdappliancemanuacuring
lecricalequipmenmanuacuring
Oherelecricalequipmenand
componens
Oherransporaionequipmen
Householdandinsiuionalurniureand
ichencabines
Medicalequipmenandsupplies
Ohermiscellaneousmanuacuring
Commercialequipmen
lecricalandelecronicgoods
rocerandrelaedproducs
rocersores
Deparmensores
lecronicshoppingandmail-orderhouses
reighransporaionarrangemen

InellecualProperandheUSconomUpdae
Nespaperperiodicalbooanddirecor
publishers
Soarepublishers
Moionpicureandideoindusries
SoundrecordingIndusries
adioandeleisionbroadcasing
Cableandohersubscripionprogramming
iredelecommunicaionscarriers
Oherelecommunicaions
Oherinormaionserices
ciiiesrelaedocrediinermediaion
Securiiesandcommodiechanges
Ohernancialinesmenaciiies
Insurancecarriers
Oherinesmenpoolsandunds
essorsorealesae
Machinerandequipmenrenaland
leasing
essorsononnancialinangibleasses
ecepcoprighedors
Specialieddesignserices
Compuerssemsdesignandrelaed
serices
Managemenandechnicalconsuling
serices
derisingandrelaedserices
Oherproessionalandechnicalserices
Ohersupporserices
Oupaiencareceners
Medicalanddiagnosiclaboraories
Oherambulaorhealhcareserices
Perormingarscompanies
Independenarissriersand
perormers
amblingindusries
Ciicandsocialorganiaions
Source: USPTO calculations using data from the Bureau of Labor Statistics’ Industry Productivity program.
Note: Employment includes wage and salary jobs, the self-employed, and unpaid family workers and is measured in thousands
of jobs.

InellecualProperandheUSconomUpdae
Table A-11. IP-Related Products and Services in the 2017
North American Product Classication System (NACPS)
NPCS code ile
Conracproducionsericesorinellecualproper
ieperormancesproducedunderconrac
Conracliesporingeens
Conracliepublicappearancesandspeeches
Supporsericesorproducionoaudioisualorsandsudiosoundrecordings
clusiirighs
icensingorighsouseinellecualproperproecedbrademar
icensingorighsouseinellecualproperproecedbcoprigh
Ourighsaleoinellecualproperproecedbcoprigh
Conracproducionsericesorinellecualproperproecedbcoprigheclude
lieperormingars
Conracdesignsericesorinellecualproperproecedbrademar
icensingodomesicrighsodisribueaudioisualors
icensingodomesicrighsoehibibroadcasorreneaurelms
icensingodomesicrighsoehibibroadcasorrenshorlms
icensingodomesicrighsobroadcasorreneleisionprogramming
icensingodomesicrighsoehibibroadcasorrenoheraudioisualors
icensingoinernaionalrighsodisribueaudioisualors
icensingoinernaionalrighsoehibibroadcasorrenaudioisualors
icensingoinernaionalrighsouseconcepodomesicaudioisualors
icensingoinernaionalrighsoroherusesoaudioisualors
Conracproducionsericesoraudioisualors
icensingorighsousemusicalcomposiions
icensingorighsousemusicalcomposiions-orecordandreproduceor
commercialuseecepordisribuionasphonorecordsieelecricalranscripion
righs
icensingorighsousemusicalcomposiions-Inadramaicoriegrandrighs
anddramaicadopionrighs
icensingorighsousemusicalcomposiions-Inoherors
icensingoinernaionalrighsopublishdomesicmusicalcomposiionsie
inernaionalsub-publishing
icensingorighsousemusicalrecordings
dminisraionocoprighsorohers
Merchandiselicensing-Domesicandinernaional
icensingorighsousemusic
icensingorighsouseaudioisualors
Conracproducionsericesororiginalmusicecludingmusicoraudioisualors

InellecualProperandheUSconomUpdae
icensingorighsoreproduceanddisribuecompuersoare
icensingorighsobroadcasradioprograms
icensingorighsodisribuespecialaudioprogrammingconen
icensingorighsobroadcaseleisionprograms
icensingorighsodisribuespecialeleisionprogrammingconen
icensingorighsosndicaedmediaconen
Paencoprighandoherinellecualproperdocumenlingandsearchserices
icensingorighsoreproduceanddisribuecompuersoareproecedb
coprigh
icensingorighsousesocphoos
Paenbroeringmareingserices
Paendraingandrademarillusraionserices
Ourighsaleooriginalorsoinellecualproper
icensingorighsouseinellecualproper
icensingorighsouseinellecualproperproecedasindusrialproper
icensingorighsouseinellecualproperproecedbcoprighs
icensingandroalagreemensoeploinauralresources
Source: U.S. Census Bureau at http://www.census.gov/eos/www/napcs/.

InellecualProperandheUSconomUpdae
NCS
35 U.S.C. § 154(a) (1)
Smith v. Chanel, Inc. 402 F.2d 562, 566 (9
th
Cir. 1968).
Abraham, Lincoln. 1953. In R.P. Pasler, M.D. Pratt, & L.A. Dunlap (Eds.), Complete Works of Abraham
Lincoln, Vol. 5. Rutgers University Press.
Arora, A., S. Belenzon, and L.A. Rios. 2011. The Organization of R&D in American Corpora-
tions: the Determinants and Consequences of Decentralization. NBER Working Paper No.
17013. www.nber.org/papers/w17013
Arora, A., S. Athreye. 2012. Patent Incentives: Returns to Patenting and the Inducement for Research &
Development.UKIntellectualPropertyOfce
Arora, Ashish, W.M. Cohen, J.P. Walsh. 2014. The Acquisition and Commercialization of Invention in
American Manufacturing: Incidence and Impact. NBER Working Paper No. 20264
EconomicsandStatisticsAdministrationandUnitedStatesPatentandTrademarkOfce.Intellectual
Property and the U.S. Economy: Industries in Focus. http://www.uspto.gov/sites/default/les/news/
publications/IP_Report_March_2012.pdf
EuropeanPatentOfceandOfceforHarmonizationintheInternalMarket.2013.Intellectual Property
Rights Intensive Industries: Contribution to Economic Performance and Employment in the Europe-
an Union. http://ec.europa.eu/internal_market/intellectual-property/docs/joint-report-epo-ohim-nal-
version_en.pdf
Gordon, Robert. 2016. The Rise and Fall of American Growth: The U.S. Standard of Living Since the
Civil War. Princeton University Press.
Farre-Mensa,Joan,D.Hegde,andA.Ljungqvist,2015.The Bright Side of Patents. USPTO Economic
WorkingPaperNo.2015–5.
Interbrand. 2013. Best Global Brands. http://www.rankingthebrands.com/PDF/Best%20Global%20
Brands%202013,%20Interbrand.pdf
Jaffe, Adam and M. Trajtenberg. 2002. Patents, Citations and Innovations: A Window on the
Knowledge Economy. MIT Press.
OfceforHarmonizationintheInternalMarket.2015.Intellectual Property Rights and Firm
Performance in Europe: an Economic Analysis. https://euipo.europa.eu/ohimportal/docu-
ments/11370/80606/Intellectual+property+rights+and+rm+performance+in+Europe
Siwek, Stephen E. 2009. Copyright Industries in the Economy: the 2003–2007 Report. Econ-
omists Incorporated. Prepared for the International Intellectual Property Alliance (IIPA).
www.ei.com/downloadables/IIPASiwekReport2003-07.pdf

InellecualProperandheUSconomUpdae
TradeUp Capital Fund and Nextrade Group, LLC. 2015. State of SME Finance in the United Stated
in 2015. http://www.tradeupfund.com/uploads/2/6/0/4/26048023/state_of_sme_nance_in_
the_united_states_2015.pdf
U.S.PatentandTrademarkOfce.U.S.DepartmentofCommerce.2010.Trademark Manual of
Examining Procedure (TMEP). 7th edition. tess2.uspto.gov/tmdb/tmep/
World Intellectual Property Organization. 2003. Guide on Surveying the Economic Contribution of the
Copyright-based industries.
